
33
Figure 2.13
shows aggregate trends in OIC countries that participated in PISA assessment. Two
OIC member states (Albania and Indonesia) joined PISA assessment in 2000 and three in 2003
round (Indonesia, Turkey and Tunisia) so that long-term analysis is possible. The HPEAs group
once again dominates others in all rounds of PISA assessment regardless of the test subject. In
contrast, the average for the OIC is below all other country groups during 2000-2015. However,
compared to performance in TIMSS, there is a rising tendency in the OIC average scores in
mathematics, science and reading in PISA assessment. Nonetheless, even by 2015, the average
score for the participating OIC countries is only slightly above 400 PISA points.
Overall, the evidence presented in
Figures 2.11-2.13
indicate that among participating
countries, OIC as a group is behind others such as the HPEAHPEAs, European and North
American countries regardless of subjects (e.g. mathematics, reading and science) and
assessments (e.g. TIMSS, PIRLS and PISA). Moreover, while the patterns in the case of TIMSS
suggest a worsening situation over time, there is an encouraging positive trend in the case of
PISA. Part of the variation in OIC average scores is owing to changing compositions of the sample
as more member states participated in the recent rounds of TIMSS and PISA. Therefore, the
analysis at the country level are repeated to better understand cases of positive and negative
deviations within the OIC.
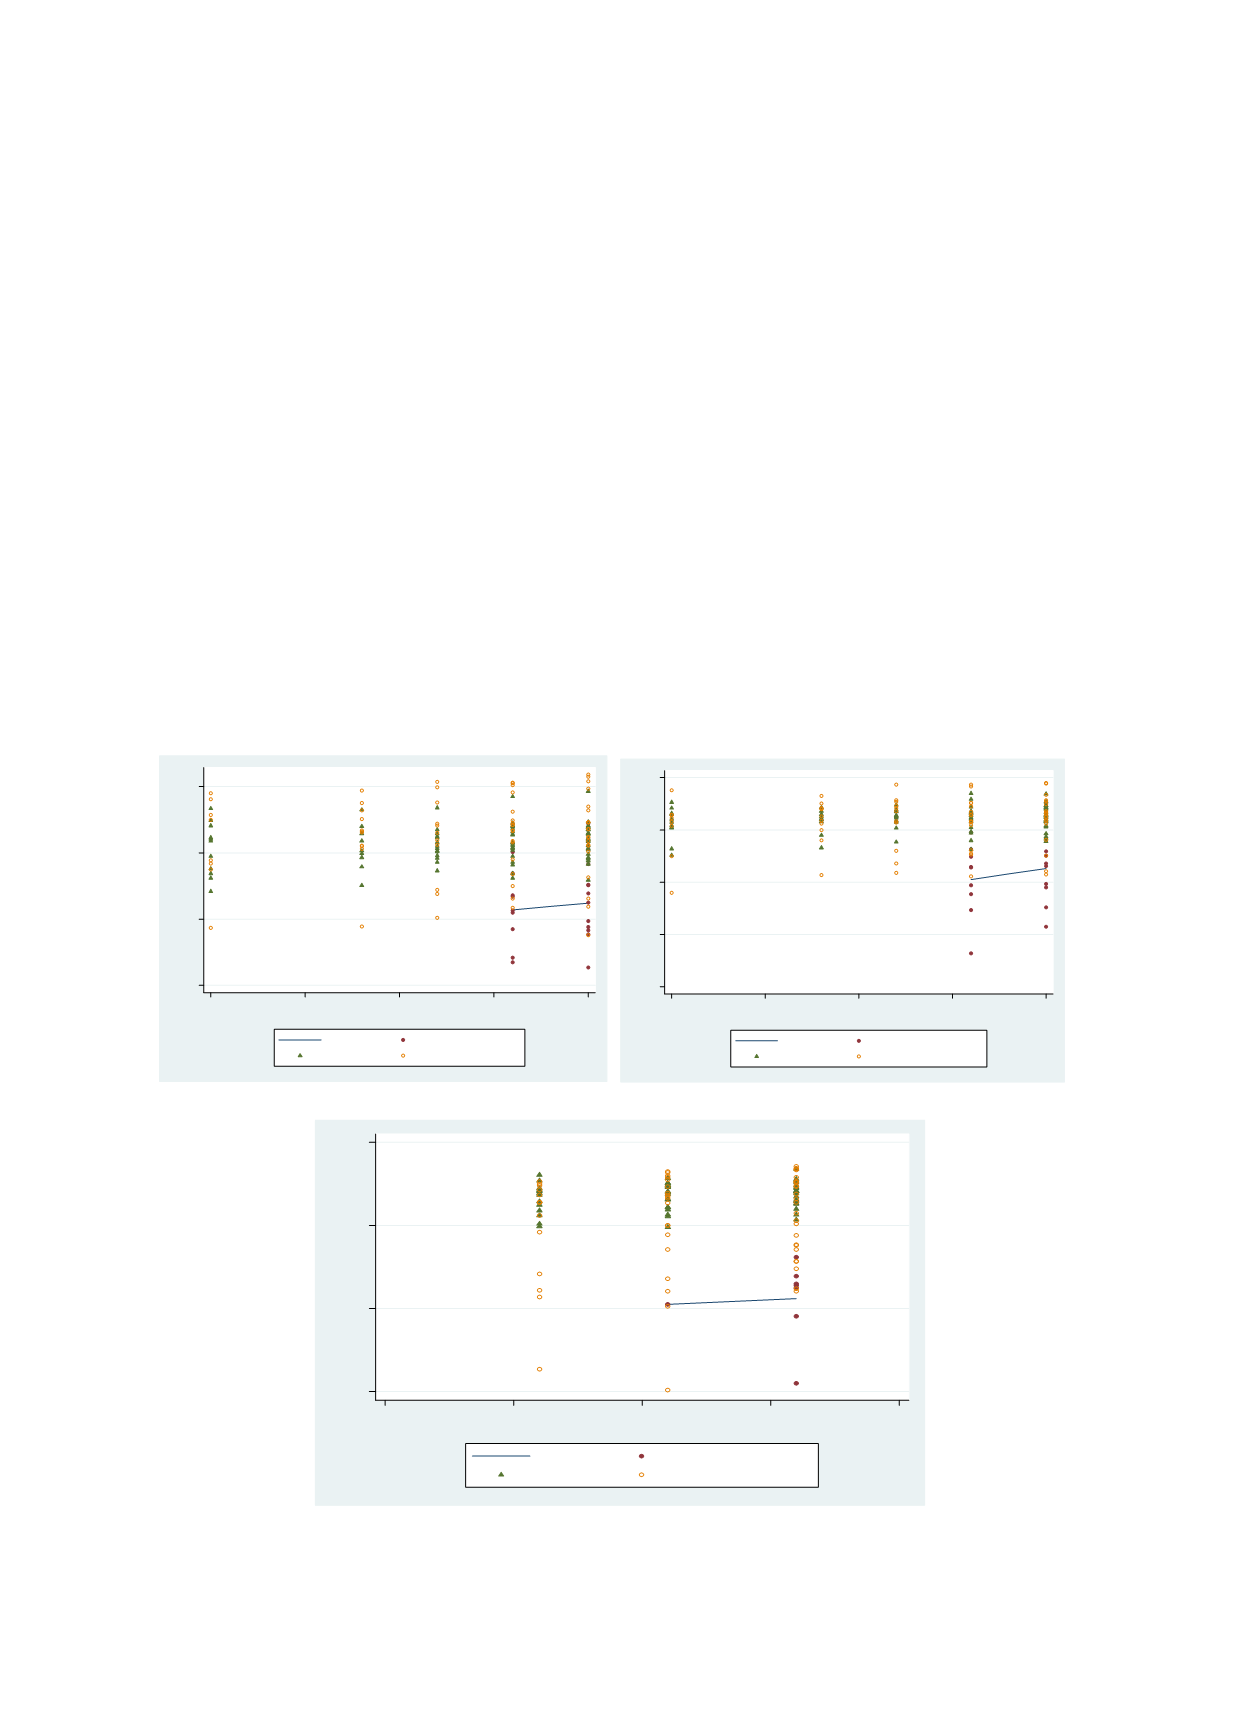
Figure 2.14: Grade 4 TIMSS (Mathematics & Science) and PIRLS (Reading) Scores by Country,
1999-2015
Source: Author’s calculation based on WIDE data
BHR
BHR
IDN
JOR
KAZ
KAZ
KWT
KWT
MAR
MAR
OMN
OMN
QAT
QAT
SAU
SAU
TUR
TUR
ARE
ARE
300
400
500
600
Mean math score in TIMSS
1995
2000
2005
2010
2015
year
OIC
OECD
NON-OECD Maths score in TIMSS
BHR
BHR
IDN
KAZ
KAZ
KWT
KWT
MAR
MAR
OMN
OMN
QAT
QAT
SAU
SAU
TUR
TUR
ARE
ARE
200
300
400
500
600
Mean Science score in TIMSS
1995
2000
2005
2010
2015
year
OIC
OECD
NON-OECD Science score in TIMSS
IDN
MAR
OMN
QATSAU
ARE
AZE
IDN
300
400
500
600
Mean reading score in PIRLS
1995
2000
2005
2010
2015
year
OIC
OECD
NON-OECD Reading score in PIRLS


