
Increasing Broadband Internet Penetration
In the OIC Member Countries
100
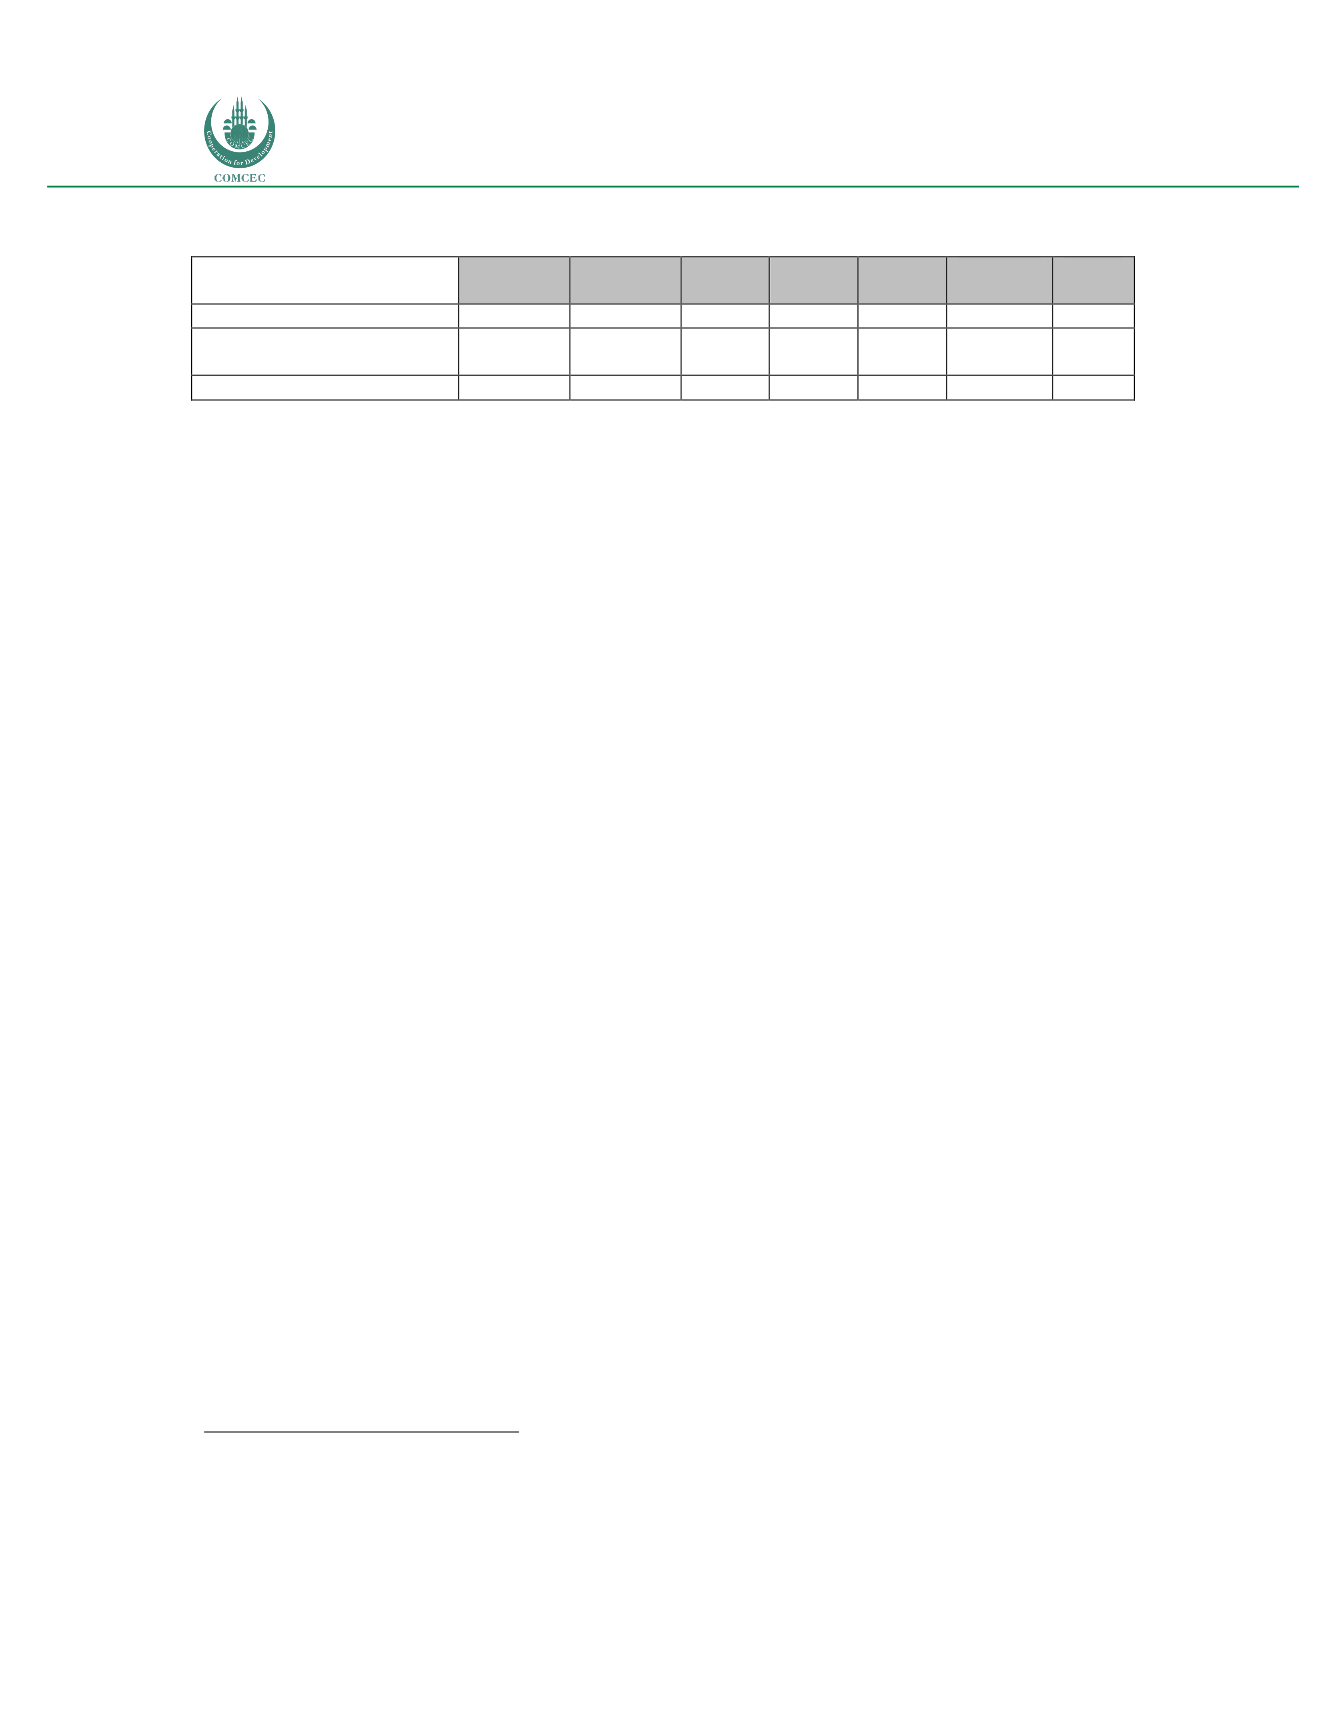
Table 45: Cote d’Ivoire: Mobile broadband demand gap (2011-2016)
2011
2012 2013 2014 2015 2016
(2Q)
CAGR
(*)
Population coverage (%)
10.00 (*) 15.00 (*)
21.78 43.56 71.00
83.00
60
Subscribers as % of
Population
0.27
0.72 14.77 24.56 40.39
32.09 160
Demand gap (%)
9.73
14.28 7.01 19.00 30.61
50.91
35
(*) Compound Annual Growth Rate
Sources: GSMA Intelligence; Autorité de régulation des télécommunications/TIC de Cote d’Ivoire; Telecom Advisory
Services analysis
Table 45 illustrates the dynamics between mobile broadband coverage and adoption in Cote
d’Ivoire. Both trends do not evolve in parallel. At some points in time, such as in 2013,
adoption outpaces the speed at which coverage is increasing. This is why the demand gap is
cut in half. When operators accelerate their deployment (such as the period between 2013 and
2016 when coverage increases from 21.78% to 83%), demand for subscriptions increases at a
slower pace. This is the time when the demand gap increases. Obviously, it is expected that
when the coverage growth rate slows down, the demand gap will contract.
Therefore, almost half of the population currently reached by broadband networks does not
purchase the service. Other research conducted by Prof. Raul Katz (Katz and Berry, 2014)
concluded that there are three factors that drive broadband non-adoption: affordability,
cultural relevance, and digital literacy. While there are no surveys in the Cote d’ Ivoire that
explore the relative importance of each of these three barriers, some conclusions can be drawn
from interviews and the analysis of related data.
Starting with affordability, Cote d’Ivoire has a telecommunications affordability index of
32.78
40
. This index reflects in the aggregate the total cost of ownership of telecommunications
services (including taxes) as a function of income. When compared with the rest of African
countries, Cote d’Ivoire is at the middle of the affordability range (see figure 29).
40
The digital affordability index is a composite index calculated on the basis of six indicators: Residential fixed line tariff
adjusted for GDP per capita; Residential fixed line connection fee adjusted for GDP per capita; Mobile cellular prepaid tariff
adjusted for GDP/capita; Mobile cellular prepaid connection fee adjusted for GDP per capita; fixed broadband Internet
access cost adjusted for GDP per capita; and mobile broadband Internet access cost adjusted for GDP per capita (see Katz
and Koutroumpis, 2013).


