
Increasing Broadband Internet Penetration
In the OIC Member Countries
96
Due to the mobile broadband suitability, the technology penetration has been growing at the
high annual rate of 170%, reaching 32.09% penetration at the end of the second quarter of
2016. The decline from the high point at the end of 2015 is partly due to the closing of
operations of two mobile operators (see market structure section below).
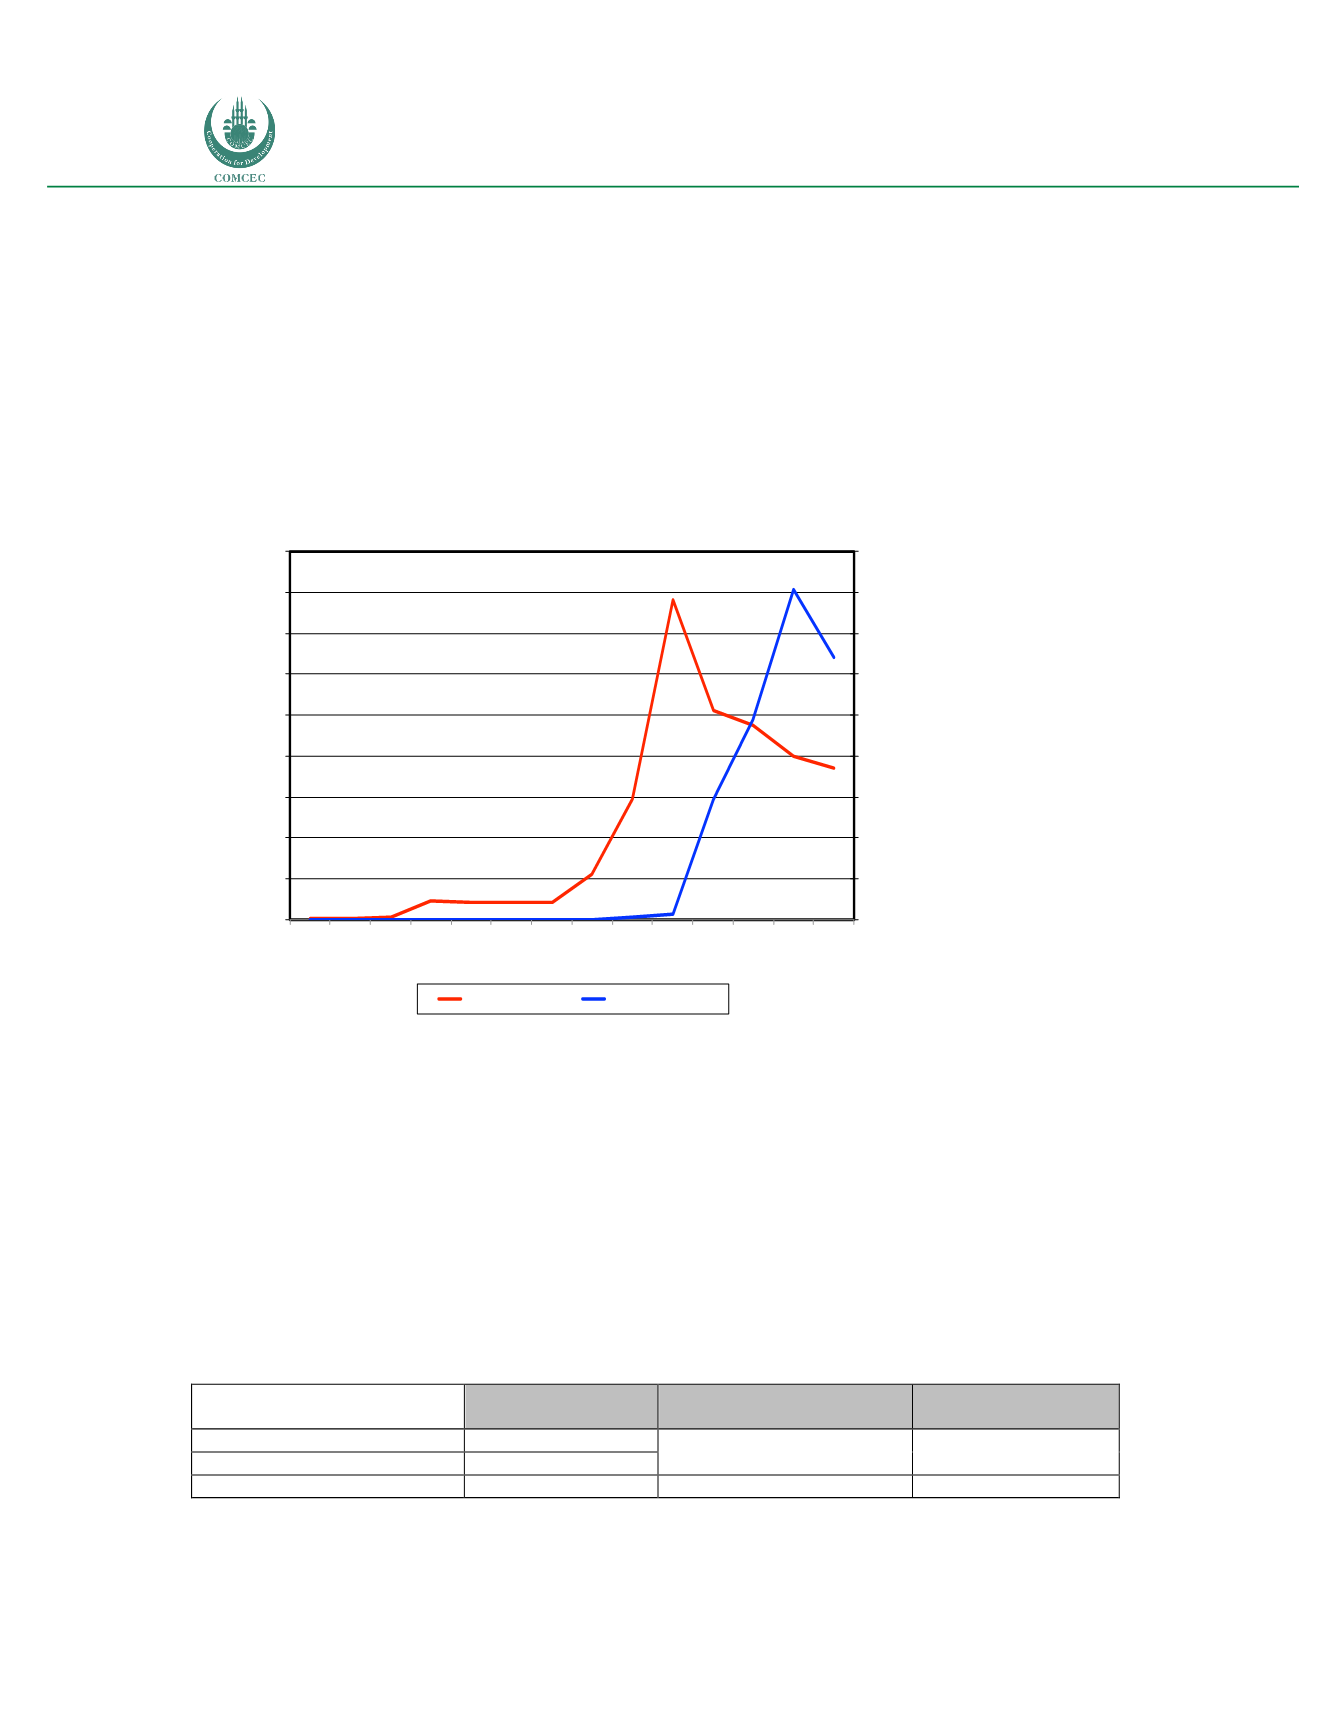
The comparative analysis of adoption trends between fixed and mobile broadband indicates a
clear substitution pattern, whereby the latter is capturing share from the former (see figure
26).
Figure 26: Cote d’Ivoire: Comparative adoption of fixed and mobile broadband (2003-2016)
Source: Autorité de régulation des télécommunications/TIC de Cote d’Ivoire; International Telecommunications Union;
Telecom Advisory Services analysis.
As figure 26 indicates, the deployment of mobile broadband networks in Cote d’Ivoire resulted
in a massive substitution effect. As soon as mobile broadband adoption picked up, the
penetration of fixed broadband started to decline.
Average monthly broadband consumption in Cote d’Ivoire indicates a variance between 3G
and 4G subscribers. This is to be expected since 3G technology does not provide an adequate
user Internet experience. On the other hand, 4G and fixed broadband consumption is
somewhat in line with what is observed in other OIC Member Countries (see table 40).
Table 40: Comparative broadband usage (2016)
Cote d’Ivoire
Middle East and Africa
(2015)
Saudi Arabia (2015)
Monthly 3G use
400 MB
908 MB
673 MB
Monthly 4G use
1 GB
Monthly ADSL use
67 GB
- - -
50.7
Note: Saudi Arabia fixed broadband reflects a wider adoption universe with lower usage intensity
Source: Field trip interviews; Cisco Visual Networking Index
0.02 0.04 0.06
0.46 0.44 0.43 0.42
1.11
2.94
7.82
5.13
4.74
4.00
3.72
0.27 0.72
14.77
24.56
40.39
32.09
0.00
5.00
10.00
15.00
20.00
25.00
30.00
35.00
40.00
45.00
0.00
1.00
2.00
3.00
4.00
5.00
6.00
7.00
8.00
9.00
2003 2004 2005 2006 2007 2008 2009 2010 2011 2012 2013 2014 2015 2016
Fixed Broadband
Mobile Broadband
Fixed&Broadband&
(Percent&of&households)&
Mobile&Broadband&
(Percent&of&popula9on)&


