


 99 / 236

Preferential Trade Agreements and Trade Liberalization Efforts in the OIC Member States
With Special Emphasis on the TPS-OIC
77
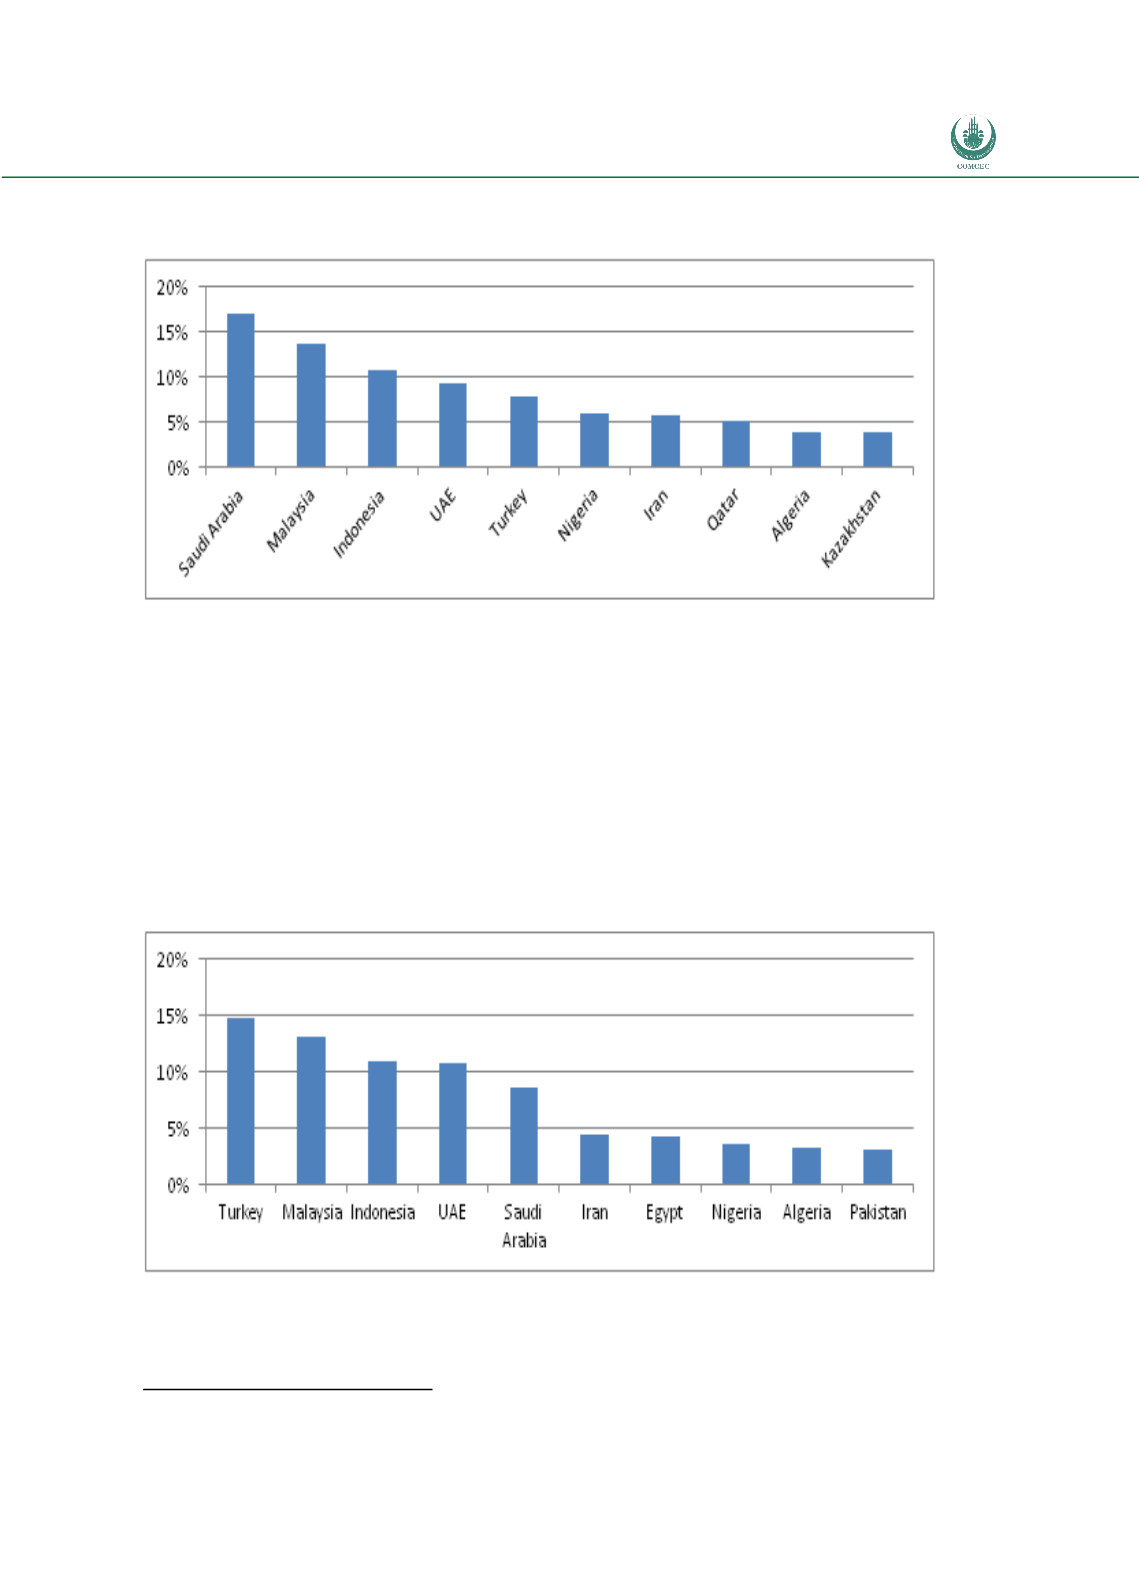
Figure 6: Largest OIC Exporting Countries 2010 (share in total OIC exports to World)
Source: Comtrade data via WITS
The largest OIC importing countries largely coincide with the largest exporters, although there
are some changes in the ranking. In 2010, top 10 importers accounted for 77% and top 20
importers for 94% of total OIC imports
14
. Top five importers were Turkey (14.8%), Malaysia
(13.2%), Indonesia (11.0%), UAE (10.7%) and Saudi Arabia (8.6%). In 2000 corresponding
figures were Turkey (14.3%), Malaysia (21.2%), Indonesia (8.7%), UAE (7.2%) and Saudi
Arabia (7.7%).
Figure 7: Largest OIC Importing Countries 2010 (share in total OIC imports from World)
Source: Comtrade data via WITS
14
This is again based on the import data of 41 OIC countries for which data is available for 2010.