


 96 / 236

Preferential Trade Agreements and Trade Liberalization Efforts in the OIC Member States
With Special Emphasis on the TPS-OIC
74
4. TRADE LIBERALISATION OF THE OIC COUNTRIES
4.1.
GENERAL
REVIEW
OF
THE
AGREEMENTS
INVOLVING
OIC
MEMBERS
The OIC countries have been actively engaging in regional trade integration initiatives for a
number of years. This study identified as many as 113 regional trade agreements (RTAs)
involving at least one OIC member country that were signed and have not expired based on
available data.14 The majority of them (96) take the form of bilateral or plurilateral free trade
agreement (FTA), i.e. agreements where parties keep their own tariffs with regard to imports
from third countries but (typically gradually) eliminate tariffs and other barriers on most or all
of trade within the FTA group. Eight of the identified agreements take the form of a customs
union, where apart from elimination of tariff and other barriers to trade within the bloc, a
common external tariff applies to imports from third countries. Four of the identified
agreements can be explicitly classified as partial scope agreements, where concessions are
focused on selected sectors only rather than applicable to most of the trade. Five of the
identified agreements are so-called Framework Agreements that are typically meant to be an
intermediate step towards finalisation of another trade deal.
Preferences mostly apply to trade in goods, although 21 of the identified agreements covers
liberalisation of the services trade as well. The majority of the agreements (93) were notified
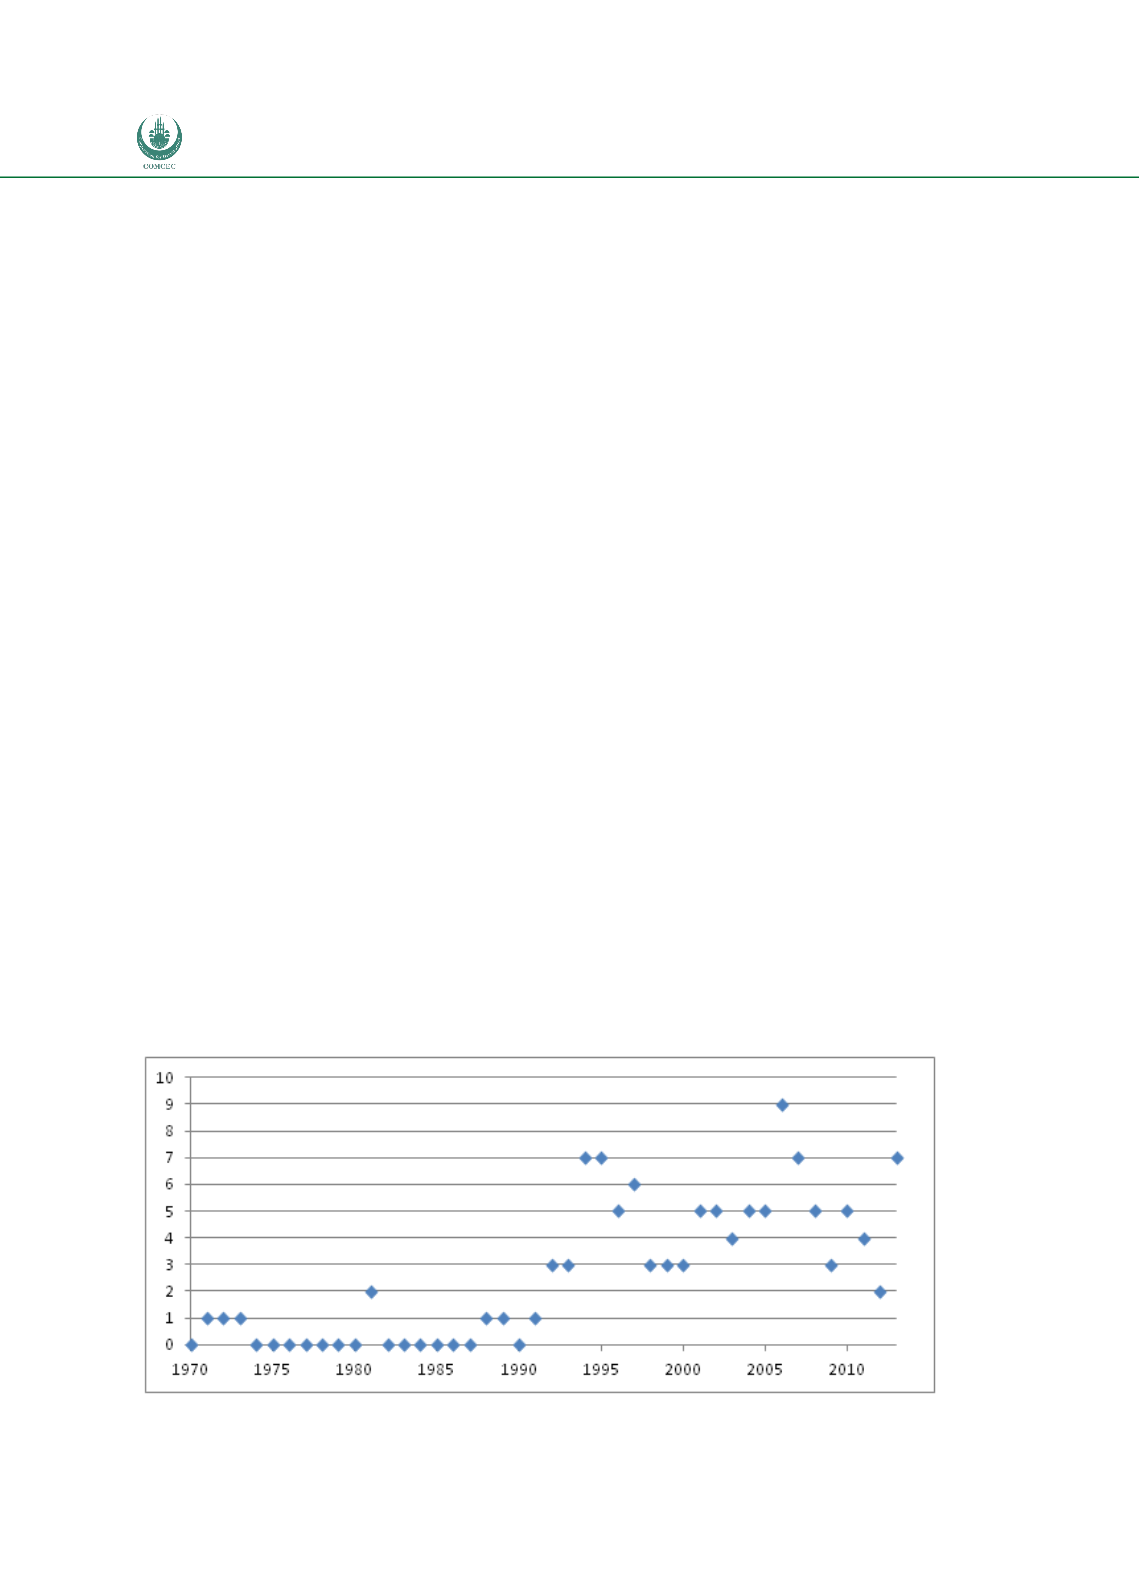
to the WTO. The last 20 years has been a period of particularly strong growth in the number of
RTAs, which matches the general pattern discussed in the preceding section. Only a few
agreements were signed before the early 1990s, while since 1994 there has been a steady
trend with several new agreements reached each year (on average 5 signatures every year in
this period). Figure 4 presents this graphically.
Figure 4:
Number of Signatures of RTAs Involving OIC Members per year, 1970-2013
Source: Calculations derived from database compiled for this project