


 79 / 213

Reducing Food Waste
In the OIC Member Countries
COMCEC
previhtc an everview, anh Table 26 mere detail, ef the extent ef feeh waste within the cervtyth
heecthelhc, by feeh type anh cencemptien stage.
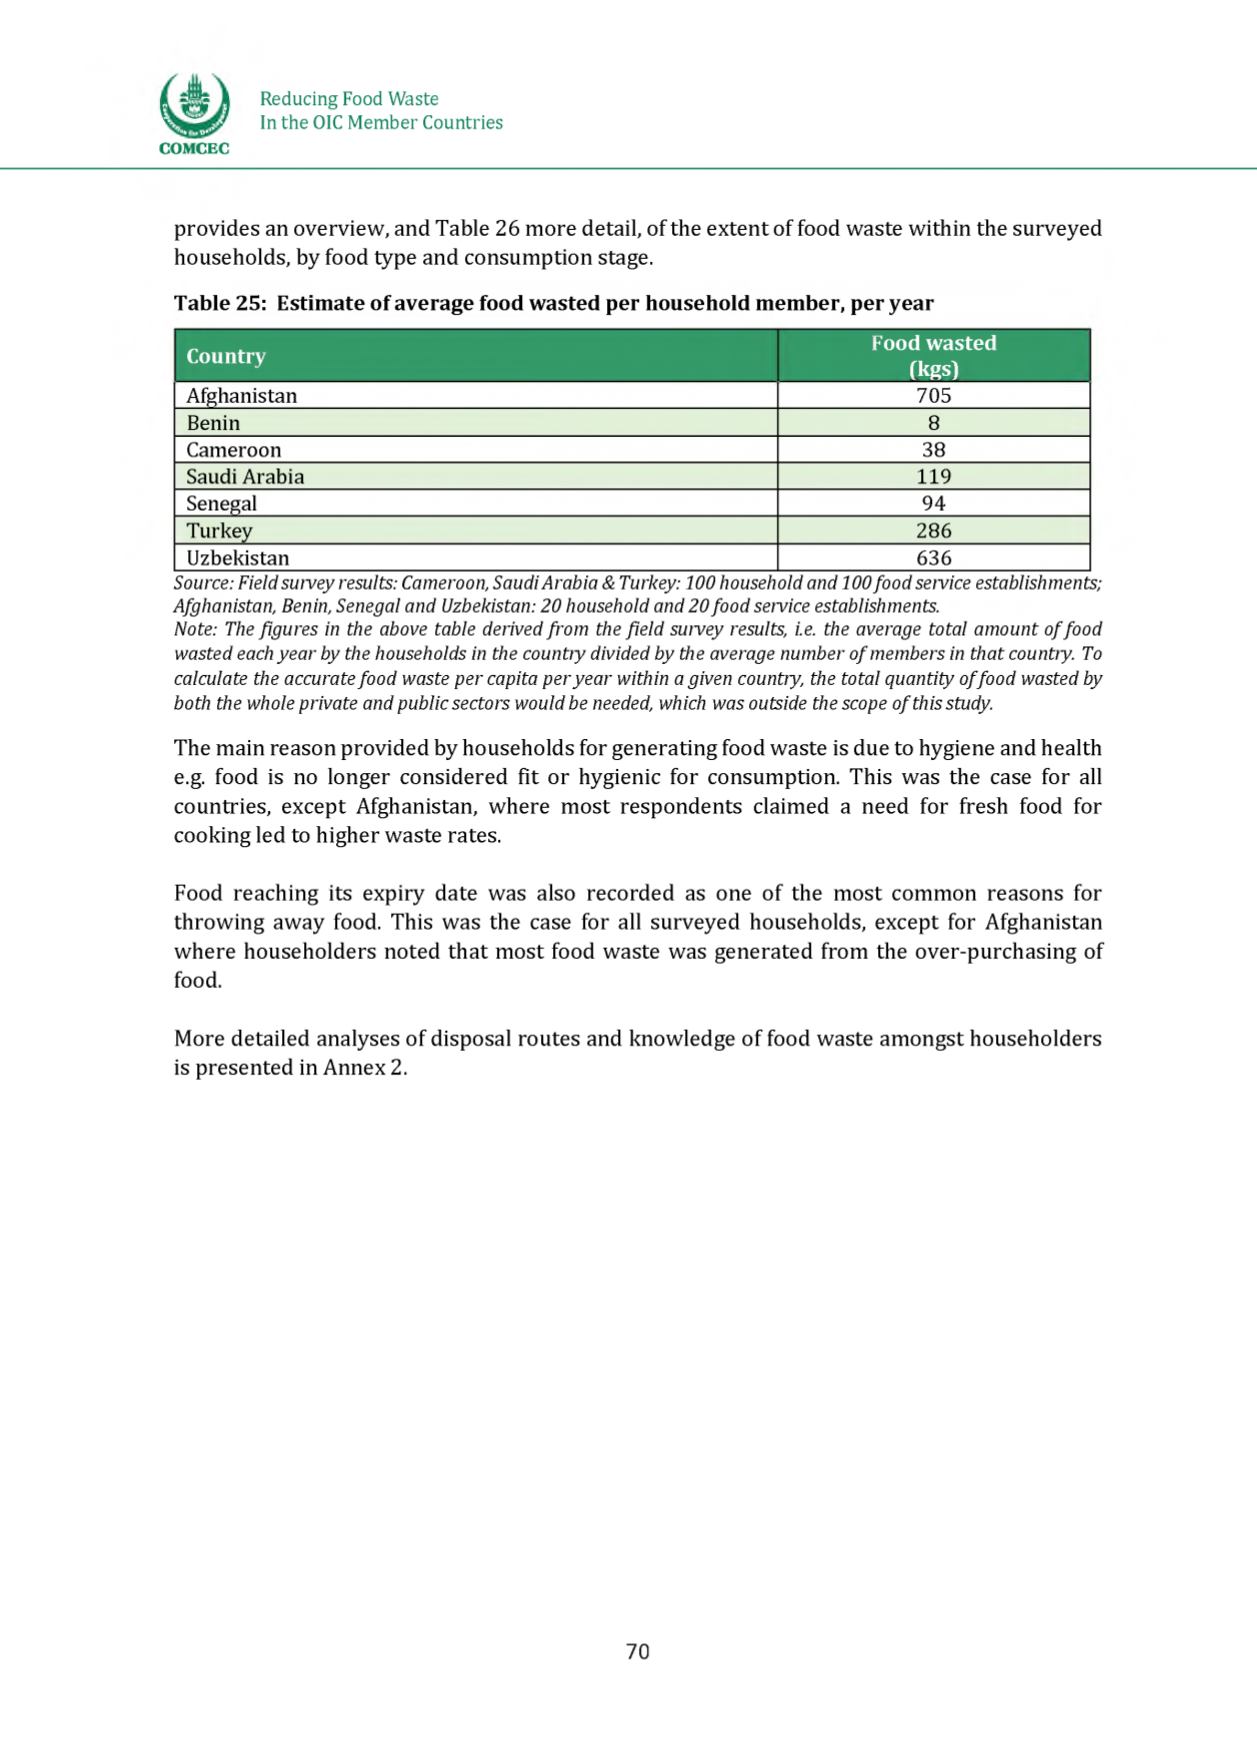
Table 25: Estimate of average food wasted per household member, per year
Country
Food wasted
(kgs)
Afghanistan
705
Benin
8
Cameroon
38
Saudi Arabia
119
Senegal
94
Turkey
286
Uzbekistan
636
Source: Field survey results: Cameroon, SaudiArabia & Turkey: 100 household and 100food service establishments;
Afghanistan, Benin, Senegal and Uzbekistan: 20 household and 20food service establishments.
Note: The figures in the above table derived from the field survey results, i.e. the average total amount o ffood
wasted each year by the households in the country divided by the average number o f members in that country. To
calculate the accurate food waste per capita peryear within a given country, the total quantity o ffood wasted by
both the whole private and public sectors would be needed, which was outside the scope o f this study.
The main reacen previheh by heecehelhc fer generating feeh waste ic hue te hygiene anh health
e.g. feeh ic ne lenger cencihereh fit er hygienic fer cencemptien. Thic wac the case fer all
ceentriec, except Afghanictan, where mect recpenhentc claimeh a neeh fer frech feeh fer
ceeking leh te higher wacte ratec.
Meeh reaching itc expiry hate wac alce recerheh ac ene ef the mect cemmen reacenc fer
threwing away feeh. Thic wac the cace fer all cerveyeh heecehelhc, except fer Afghanictan
where heecehelherc neteh that mect feeh wacte wac generateh frem the ever-perchacing ef
feeh.
Mere hetaileh analycec ef hicpecal reetec anh knewlehge ef feeh wacte amengct heecehelherc
ic precenteh in Annex 2.
70