


 78 / 213

COMCEC
Reducing Food Waste
In tFo 01CMember Countries
As with most studies of this kind, data should be interpreted as indicative. However, whilst
indicative the results provide an in-depth understanding of likely practices and the extent of
food waste across OIC Member Countries. As such, this study provides a useful platform for
further research and highlights where areas of data collection can be improved, or issues
considered.
6.2. C o u n try s u rv e y re su lts
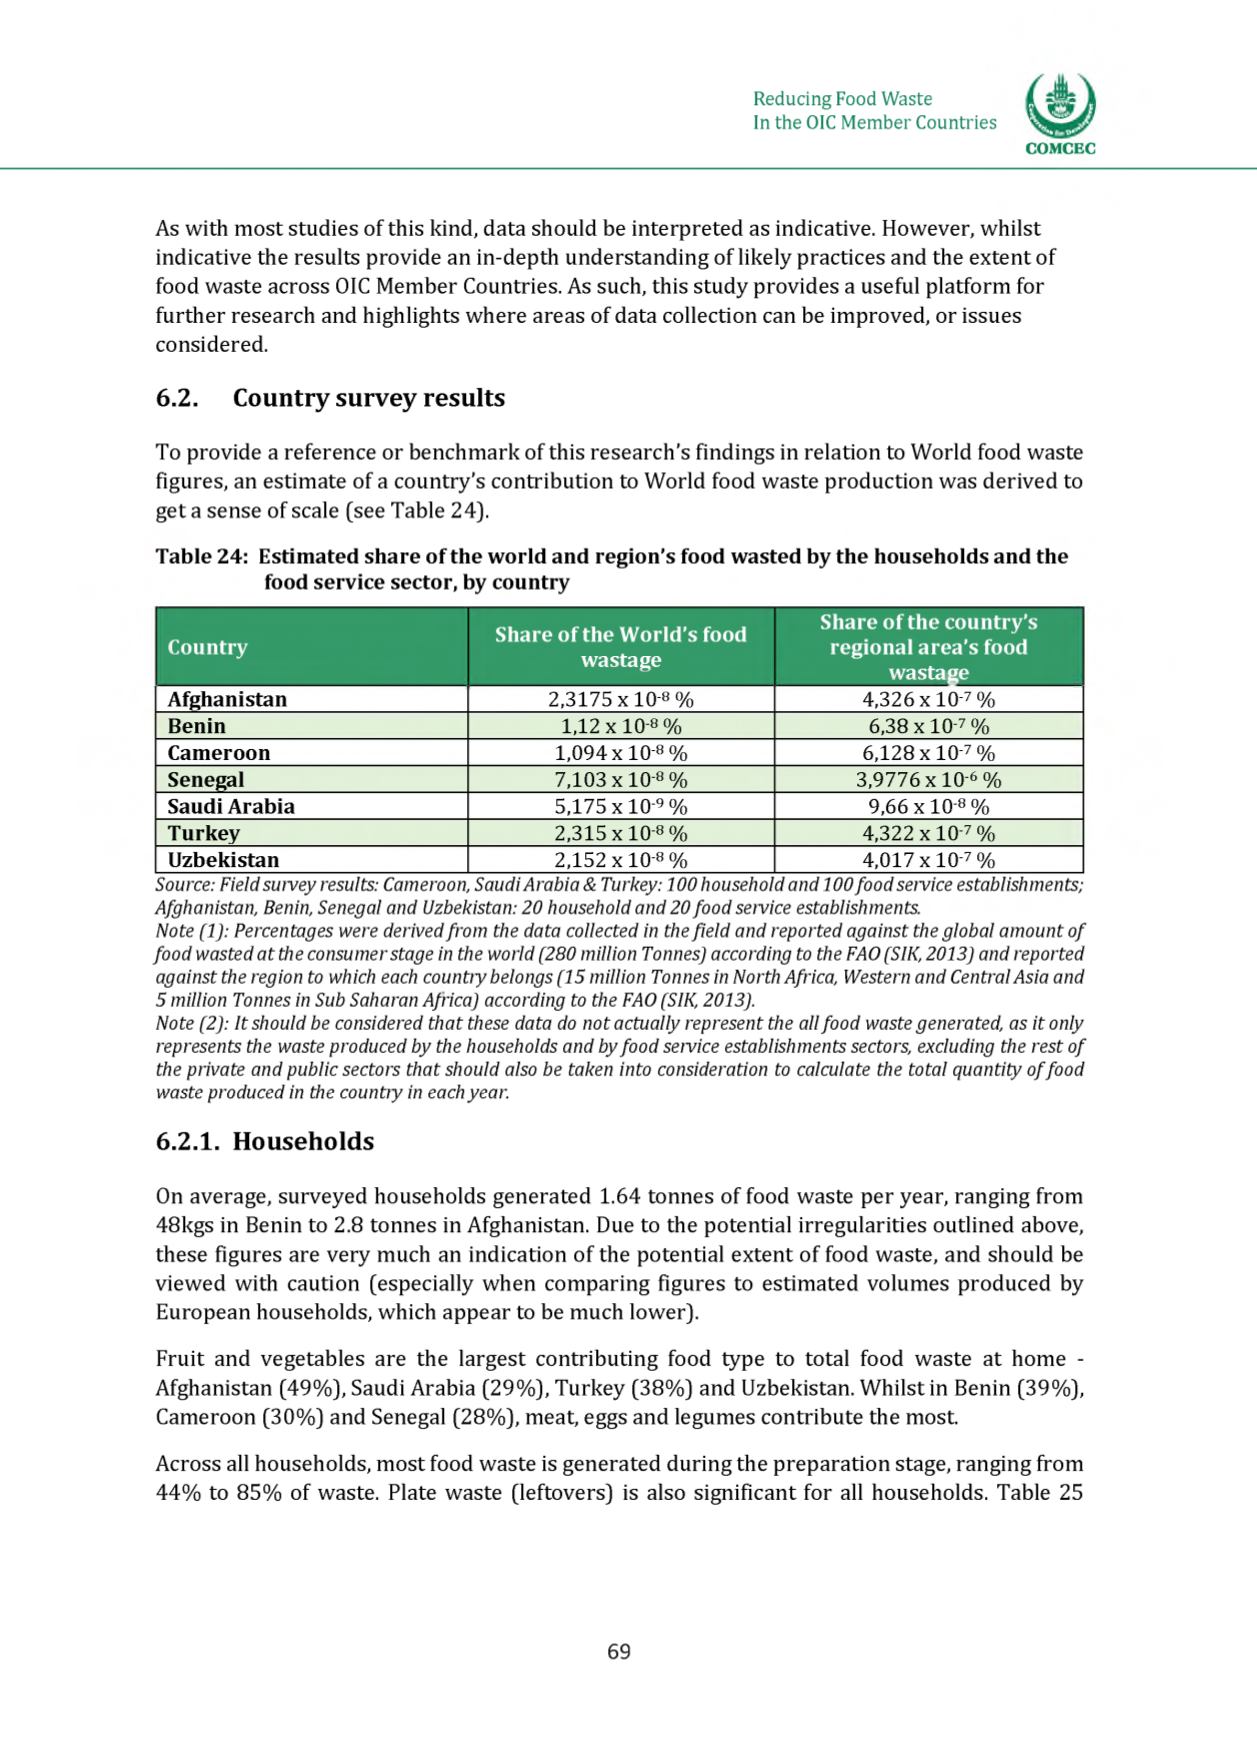
To provide a reference or benchmark of this research’s findings in relation to World food waste
figures, an estimate of a country’s contribution to World food waste production was derived to
get a sense of scale (see Table 24].
Table 24: Estimated share of the world and region's food wasted by the households and the
food service sector, by country
Country
Share of the World's food
wastage
Share of the country's
regional area's food
wastage
Afghanistan
2,3175 x 10⁻⁸%
4,326 x 10-7%
Benin
1,12 x 10⁻⁸%
6,38 x 10⁻⁷%
Cameroon
1,094 x 10-8%
6,128 x 10-7%
Senegal
7,103 x 10-8%
3,9776 x 10⁻⁶%
Saudi Arabia
5,175 x 10-9%
9,66 x 10⁻⁸%
Turkey
2,315 x 10-8%
4,322 x 10-7%
Uzbekistan
2,152 x 10-8%
4,017 x 10-7%
Source: Field survey results: Cameroon, SaudiArabia & Turkey: 100 household and 100food service establishments;
Afghanistan, Benin, Senegal and Uzbekistan: 20 household and 20 food service establishments.
Note (1): Percentages were derivedfrom the data collected in thefield and reported against the global amount of
food wasted at the consumer stage in the world (280 million Tonnes) according to the FAO (SIR, 2013) and reported
against the region to which each country belongs (15 million Tonnes in North Africa, Western and Central Asia and
5 million Tonnes in Sub Saharan Africa) according to the FAO (SIK, 2013).
Note (2): It should be considered that these data do not actually represent the allfood waste generated, as it only
represents the waste produced by the households and byfood service establishments sectors, excluding the rest of
the private and public sectors that should also be taken into consideration to calculate the total quantity o ffood
waste produced in the country in eachyear.
6.2.1. H o u s e h o ld s
On average, surveyed households generated 1.64 tonnes of food waste per year, ranging from
48kgs in Benin to 2.8 tonnes in Afghanistan. Due to the potential irregularities outlined above,
these figures are very much an indication of the potential extent of food waste, and should be
viewed with caution (especially when comparing figures to estimated volumes produced by
European households, which appear to be much lower).
Fruit and vegetables are the largest contributing food type to total food waste at home -
Afghanistan (49%), Saudi Arabia (29%), Turkey (38%) and Uzbekistan. Whilst in Benin (39%),
Cameroon (30%) and Senegal (28%), meat, eggs and legumes contribute the most.
Across all households, most food waste is generated during the preparation stage, ranging from
44% to 85% of waste. Plate waste (leftovers) is also significant for all households. Table 25
69