
COMCEC
Reducing Food Waste
In the OIC Member Countries
6.2.2. F o o d serv ice sec to r
On average, the surveyed establishments generated:
• 3 tonnes of solid food waste per year, ranging from 300kgs in Saudi Arabia to 9
tonnes in Senegal; and
• 2,100 liters of milk and other edible liquids, ranging from 330 liters in Saudi Arabia
to 9,600 liters in Senegal
Due to the potential irregularities outlined above, these figures are very much an indication of
the potential extent of food waste. Bakery is the largest food type wasted making up 50% of total
food service sector food waste in Afghanistan and Saudi Arabia (53%]. In Benin (67%),
Cameroon (35%), Senegal (38%) and Turkey (40%) meat, chicken and fish contribute the most.
Vegetables are also a significant contributor for Cameroon (35%), Turkey (40%) and Uzbekistan
(44%).
For data that was provided, carbonated drinks were the largest beverage and drinks category to
be thrown away in Afghanistan, Benin (40%), Cameroon (48%) and Uzbekistan (65%), and fruit
juice in Senegal (31%) and Turkey (55%), and yoghurt in Saudi Arabia (36%). One of the main
reasons for the high carbonated drinks wastes is due to many Islamic countries forbidding the
consumption of alcohol, and as such non-alcoholic beverages are the preferred option.
Carbonated drinks, once opened can lose their carbonation rapidly, unless stored properly, and
which leads to it being thrown away when it has gone flat.
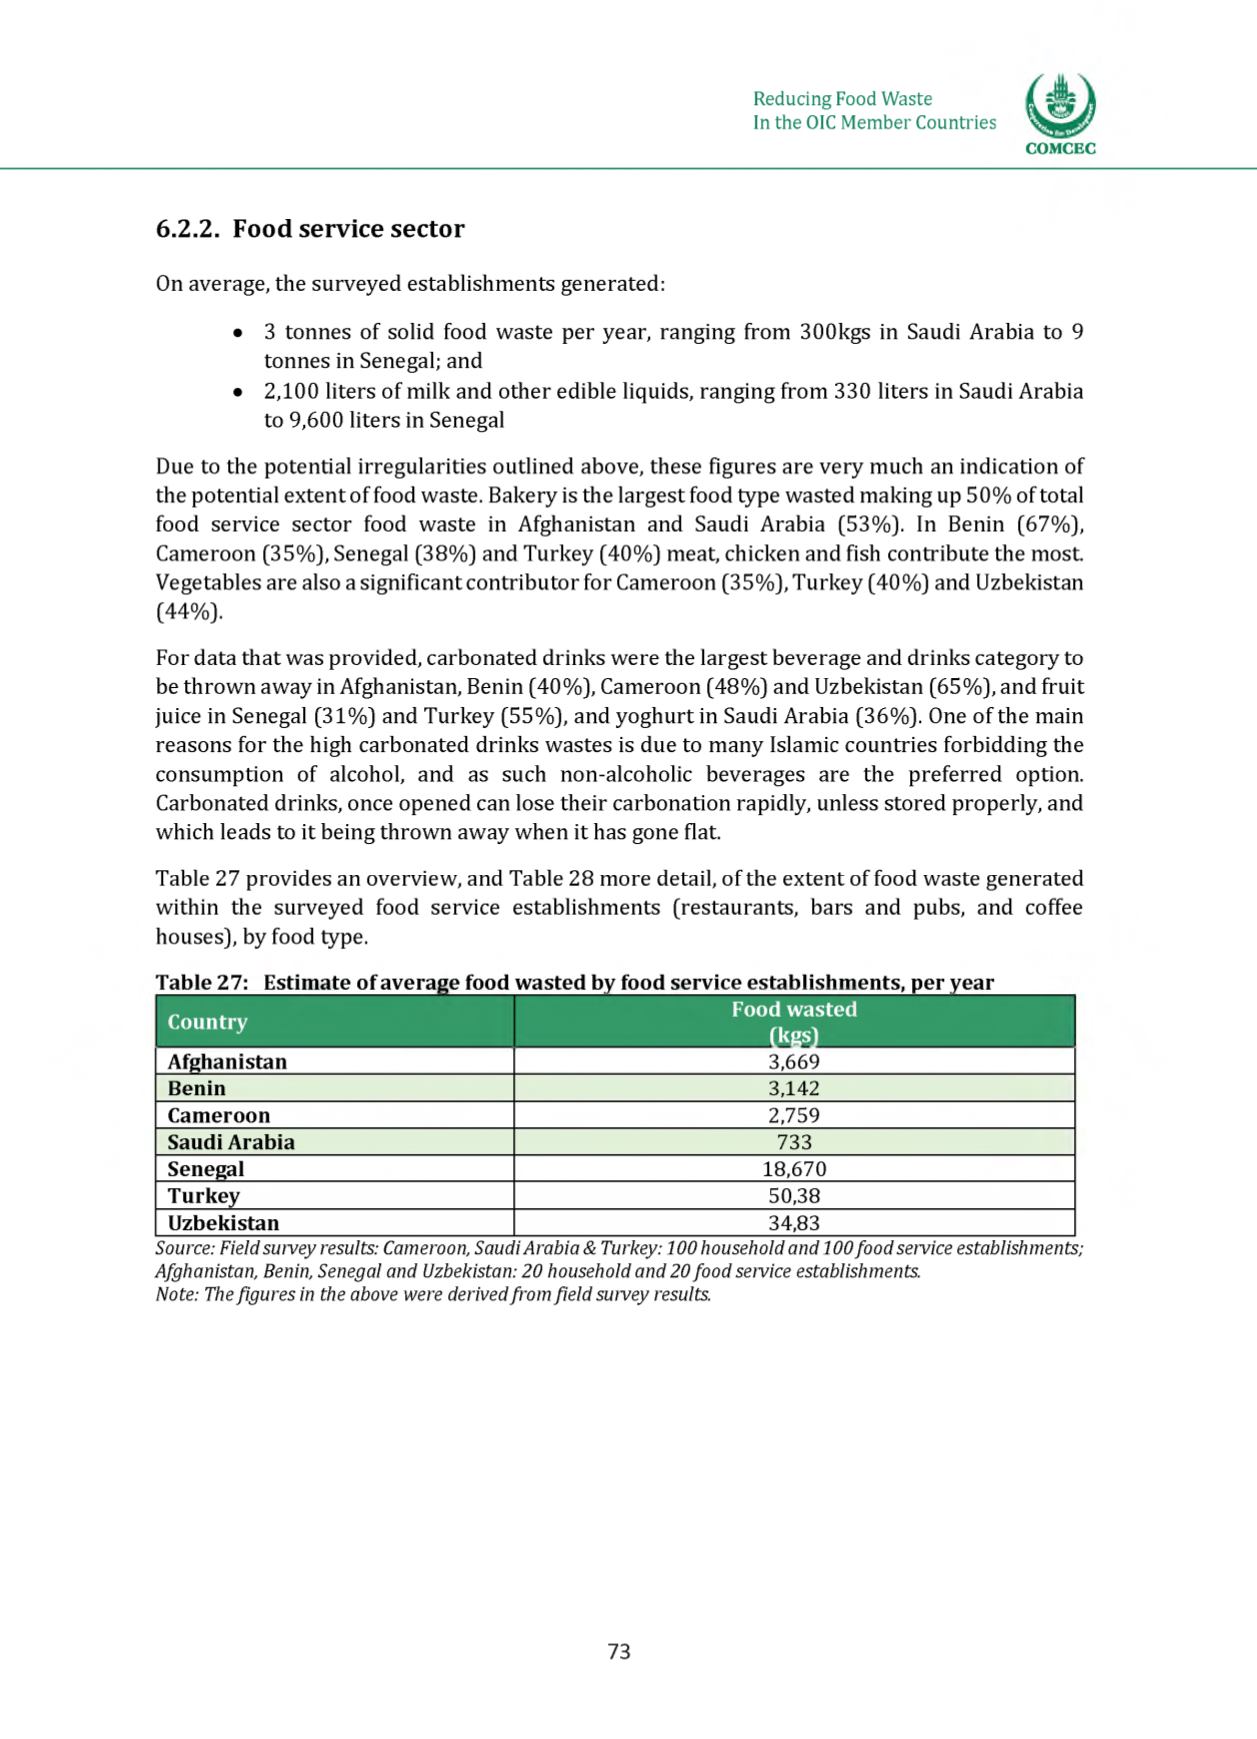
Table 27 provides an overview, and Table 28 more detail, of the extent of food waste generated
within the surveyed food service establishments (restaurants, bars and pubs, and coffee
houses), by food type.
Table 27: Estimate of average food wasted by food service establishments, per year
Food wasted
Country
(kgs)
Afghanistan
3,669
Benin
3,142
Cameroon
2,759
Saudi Arabia
733
Senegal
18,670
Turkey
50,38
Uzbekistan
34,83
Source: Field survey results: Cameroon, SaudiArabia & Turkey: 100 household and 100food service establishments;
Afghanistan, Benin, Senegal and Uzbekistan: 20 household and 20 food service establishments.
Note: Thefigures in the above were derivedfrom field survey results.
73


