


 80-81 / 213

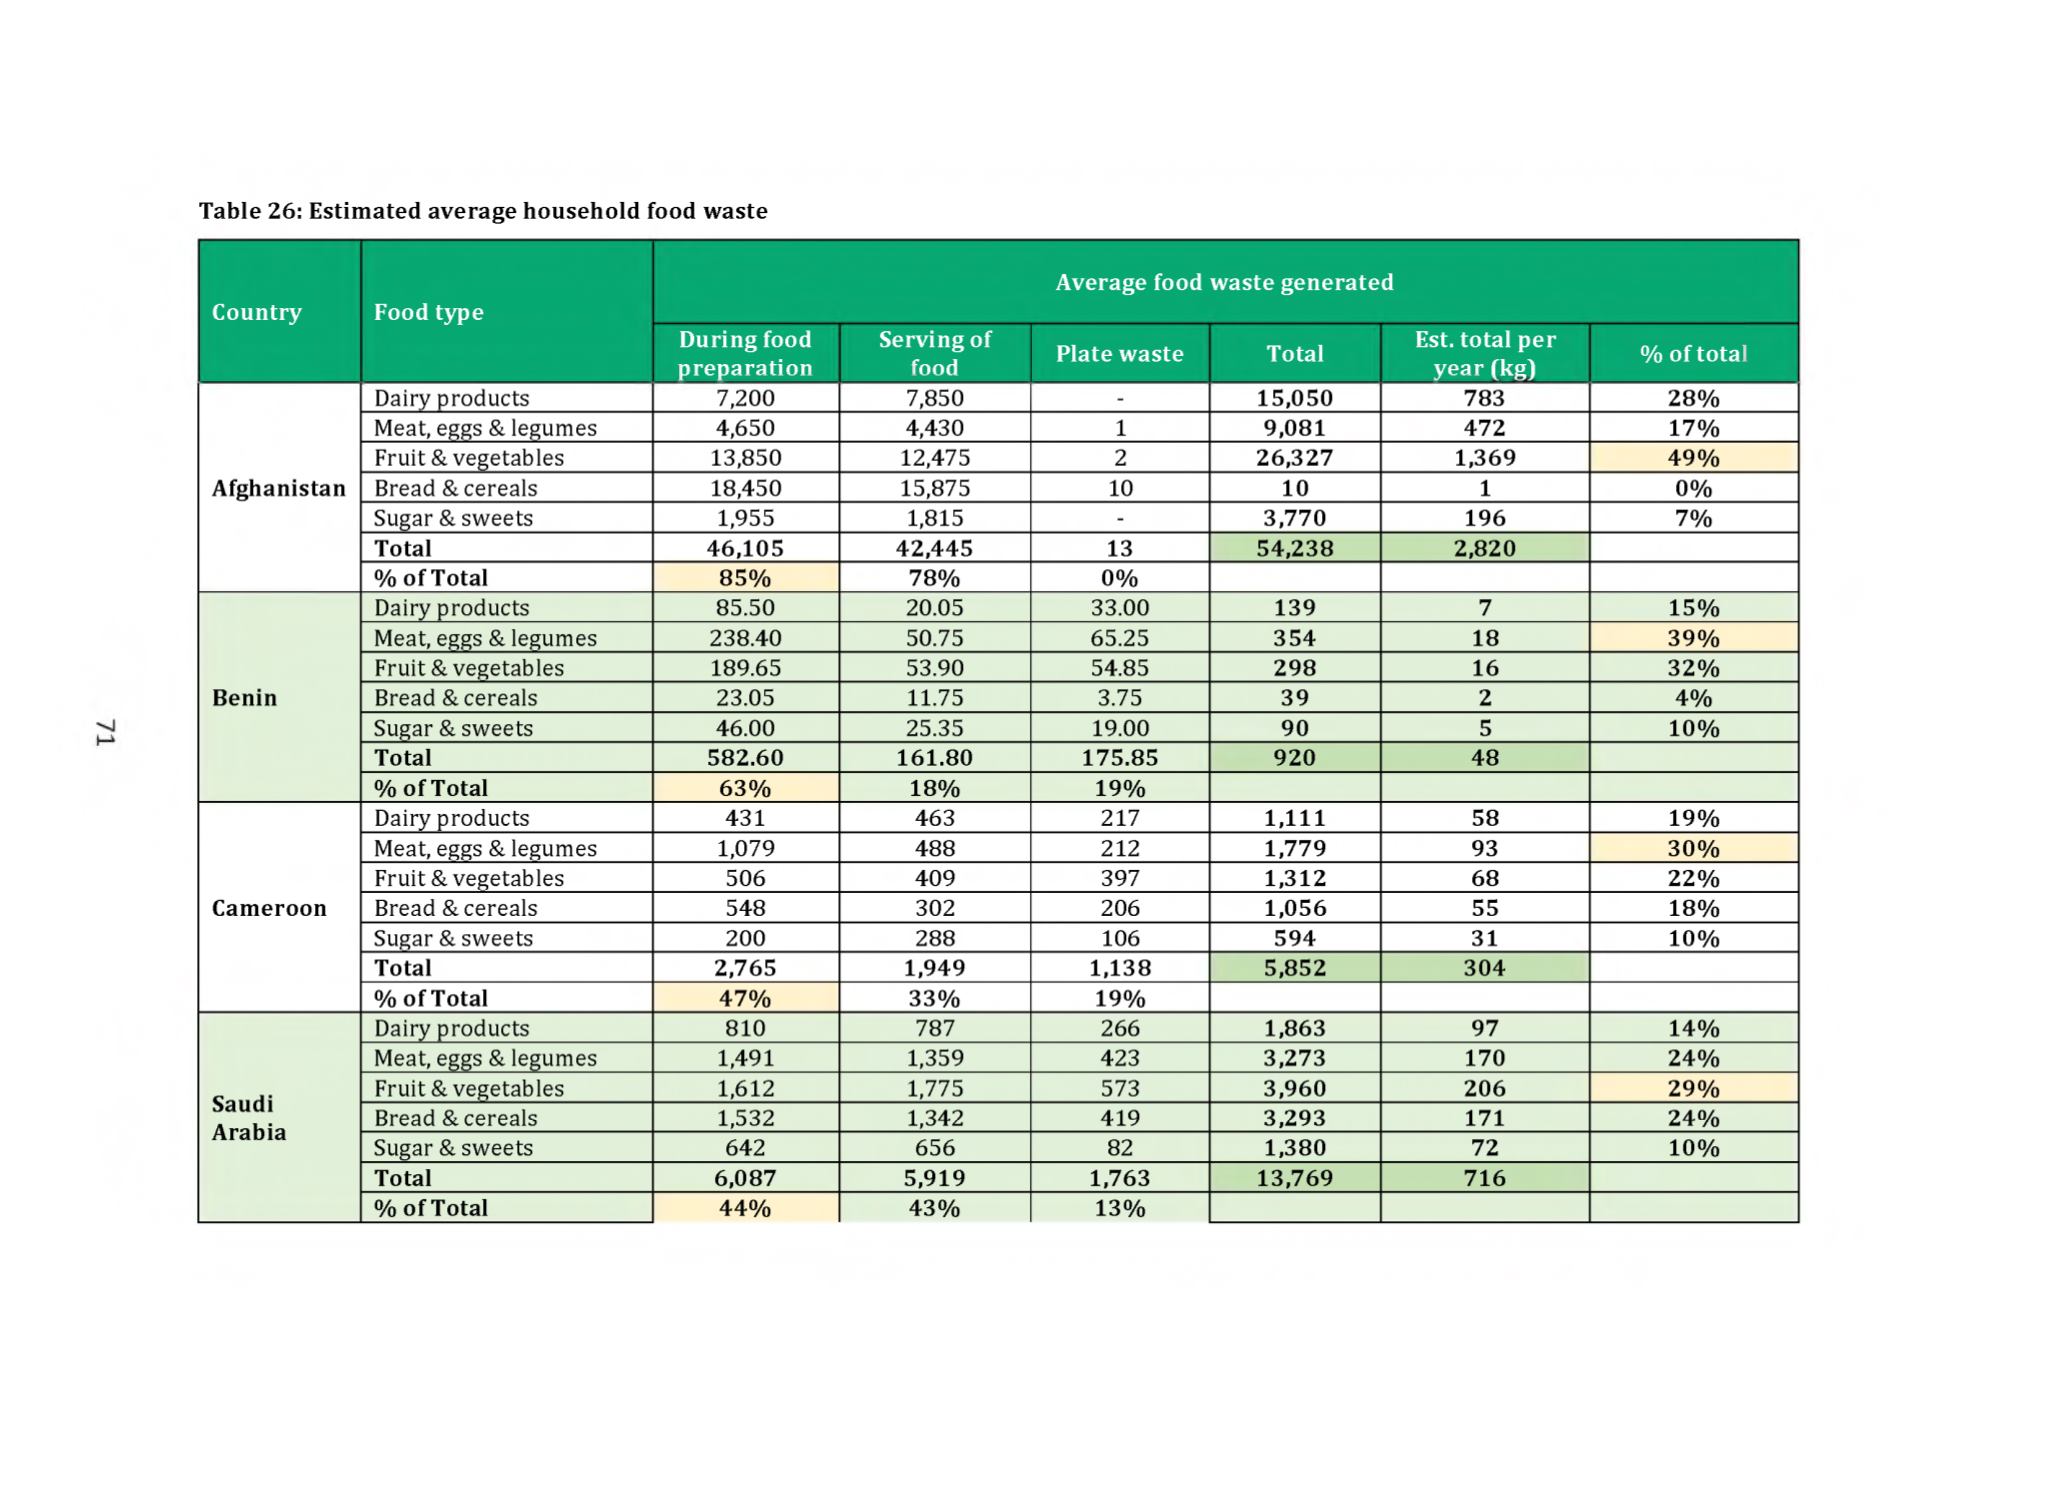
Table 26: Estimated average household food waste
Average food waste generated
Country
Food type
During food
preparation
Serving of
food
Plate waste
Total
Est. total per
year(kg)
% of total
Dairy products
7,200
7,850
-
15,050
783
28%
Meat, eggs & legumes
4,650
4,430
1
9,081
472
17%
Fruit & vegetables
13,850
12,475
2
26,327
1,369
49%
Afghanistan Bread & cereals
18,450
15,875
10
10
1
0%
Sugar & sweets
1,955
1,815
-
3,770
196
7%
Total
46,105
42,445
13
54,238
2,820
% of Total
85%
78%
0%
Dairy products
85.50
20.05
33.00
139
7
15%
Meat, eggs & legumes
238.40
50.75
65.25
354
18
39%
Fruit & vegetables
189.65
53.90
54.85
298
16
32%
Benin
Bread & cereals
23.05
11.75
3.75
39
2
4%
Sugar & sweets
46.00
25.35
19.00
90
5
10%
Total
582.60
161.80
175.85
920
48
% of Total
63%
18%
19%
Dairy products
431
463
217
1,111
58
19%
Meat, eggs & legumes
1,079
488
212
1,779
93
30%
Fruit & vegetables
506
409
397
1,312
68
22%
Cameroon Bread & cereals
548
302
206
1,056
55
18%
Sugar & sweets
200
288
106
594
31
10%
Total
2,765
1,949
1,138
5,852
304
% of Total
47%
33%
19%
Dairy products
810
787
266
1,863
97
14%
Meat, eggs & legumes
1,491
1,359
423
3,273
170
24%
Saudi
Arabia
Fruit & vegetables
1,612
1,775
573
3,960
206
29%
Bread & cereals
1,532
1,342
419
3,293
171
24%
Sugar & sweets
642
656
82
1,380
72
10%
Total
6,087
5,919
1,763
13,769
716
% of Total
44%
43%
13%