


 86 / 213

COMCEC
Reducing Food Waste
In the OIC Member Countries
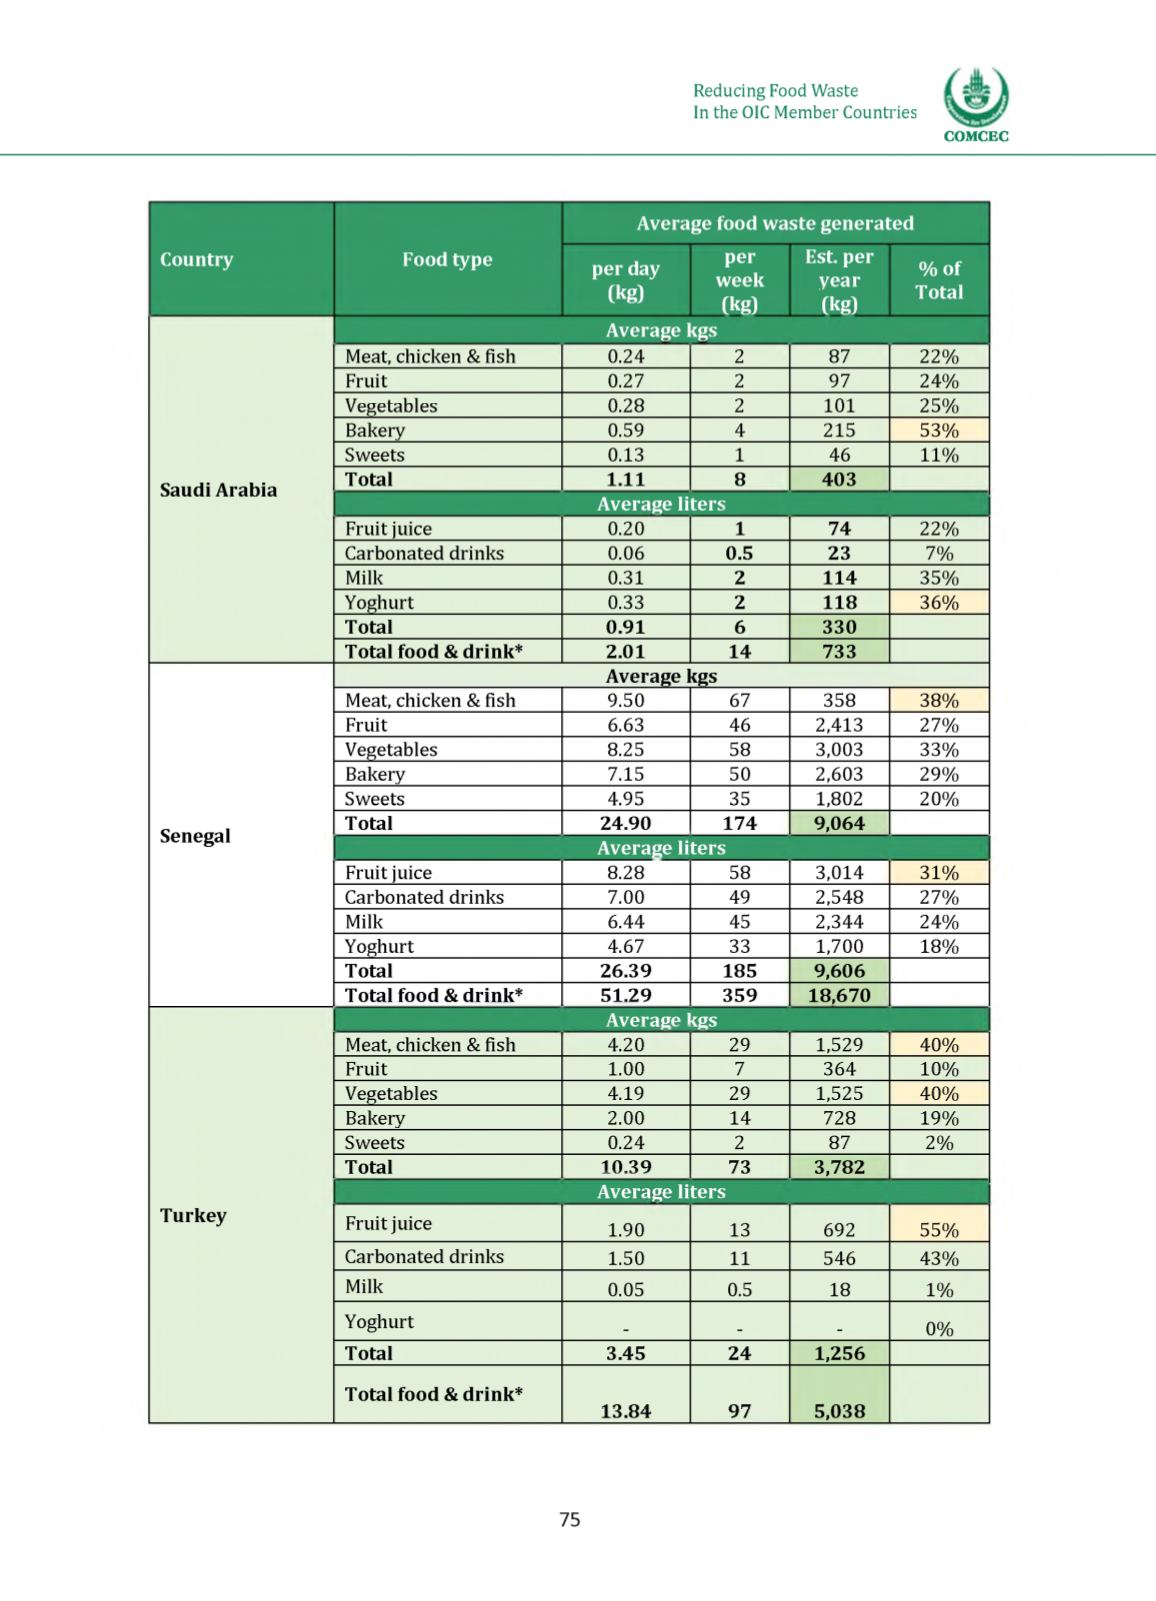
Average food waste generated
Country
Food type
per day
(kg)
per
week
(kg)
Est. per
year
(kg)
% of
Total
Average kgs
Meat, chicken & fish
0.24
2
87
22%
Fruit
0.27
2
97
24%
Vegetables
0.28
2
101
25%
Bakery
0.59
4
215
53%
Sweets
0.13
1
46
11%
Saudi Arabia
Total
1.11
8
403
Average liters
Fruit juice
0.20
1
74
22%
Carbonated drinks
0.06
0.5
23
7%
Milk
0.31
2
114
35%
Yoghurt
0.33
2
118
36%
Total
0.91
6
330
Total food & drink*
2.01
14
733
Average kgs
Meat, chicken & fish
9.50
67
358
38%
Fruit
6.63
46
2,413
27%
Vegetables
8.25
58
3,003
33%
Bakery
7.15
50
2,603
29%
Sweets
4.95
35
1,802
20%
Senegal
Total
24.90
174
9,064
Average liters
Fruit juice
8.28
58
3,014
31%
Carbonated drinks
7.00
49
2,548
27%
Milk
6.44
45
2,344
24%
Yoghurt
4.67
33
1,700
18%
Total
26.39
185
9,606
Total food & drink*
51.29
359 18,670
Average kgs
Meat, chicken & fish
4.20
29
1,529
40%
Fruit
1.00
7
364
10%
Vegetables
4.19
29
1,525
40%
Bakery
2.00
14
728
19%
Sweets
0.24
2
87
2%
Total
10.39
73
3,782
Average liters
Turkey
Fruit juice
1.90
13
692
55%
Carbonated drinks
1.50
11
546
43%
Milk
0.05
0.5
18
1%
Yoghurt
-
-
-
0%
Total
3.45
24
1,256
Total food & drink*
13.84
97
5,038
75