


 82-83 / 213

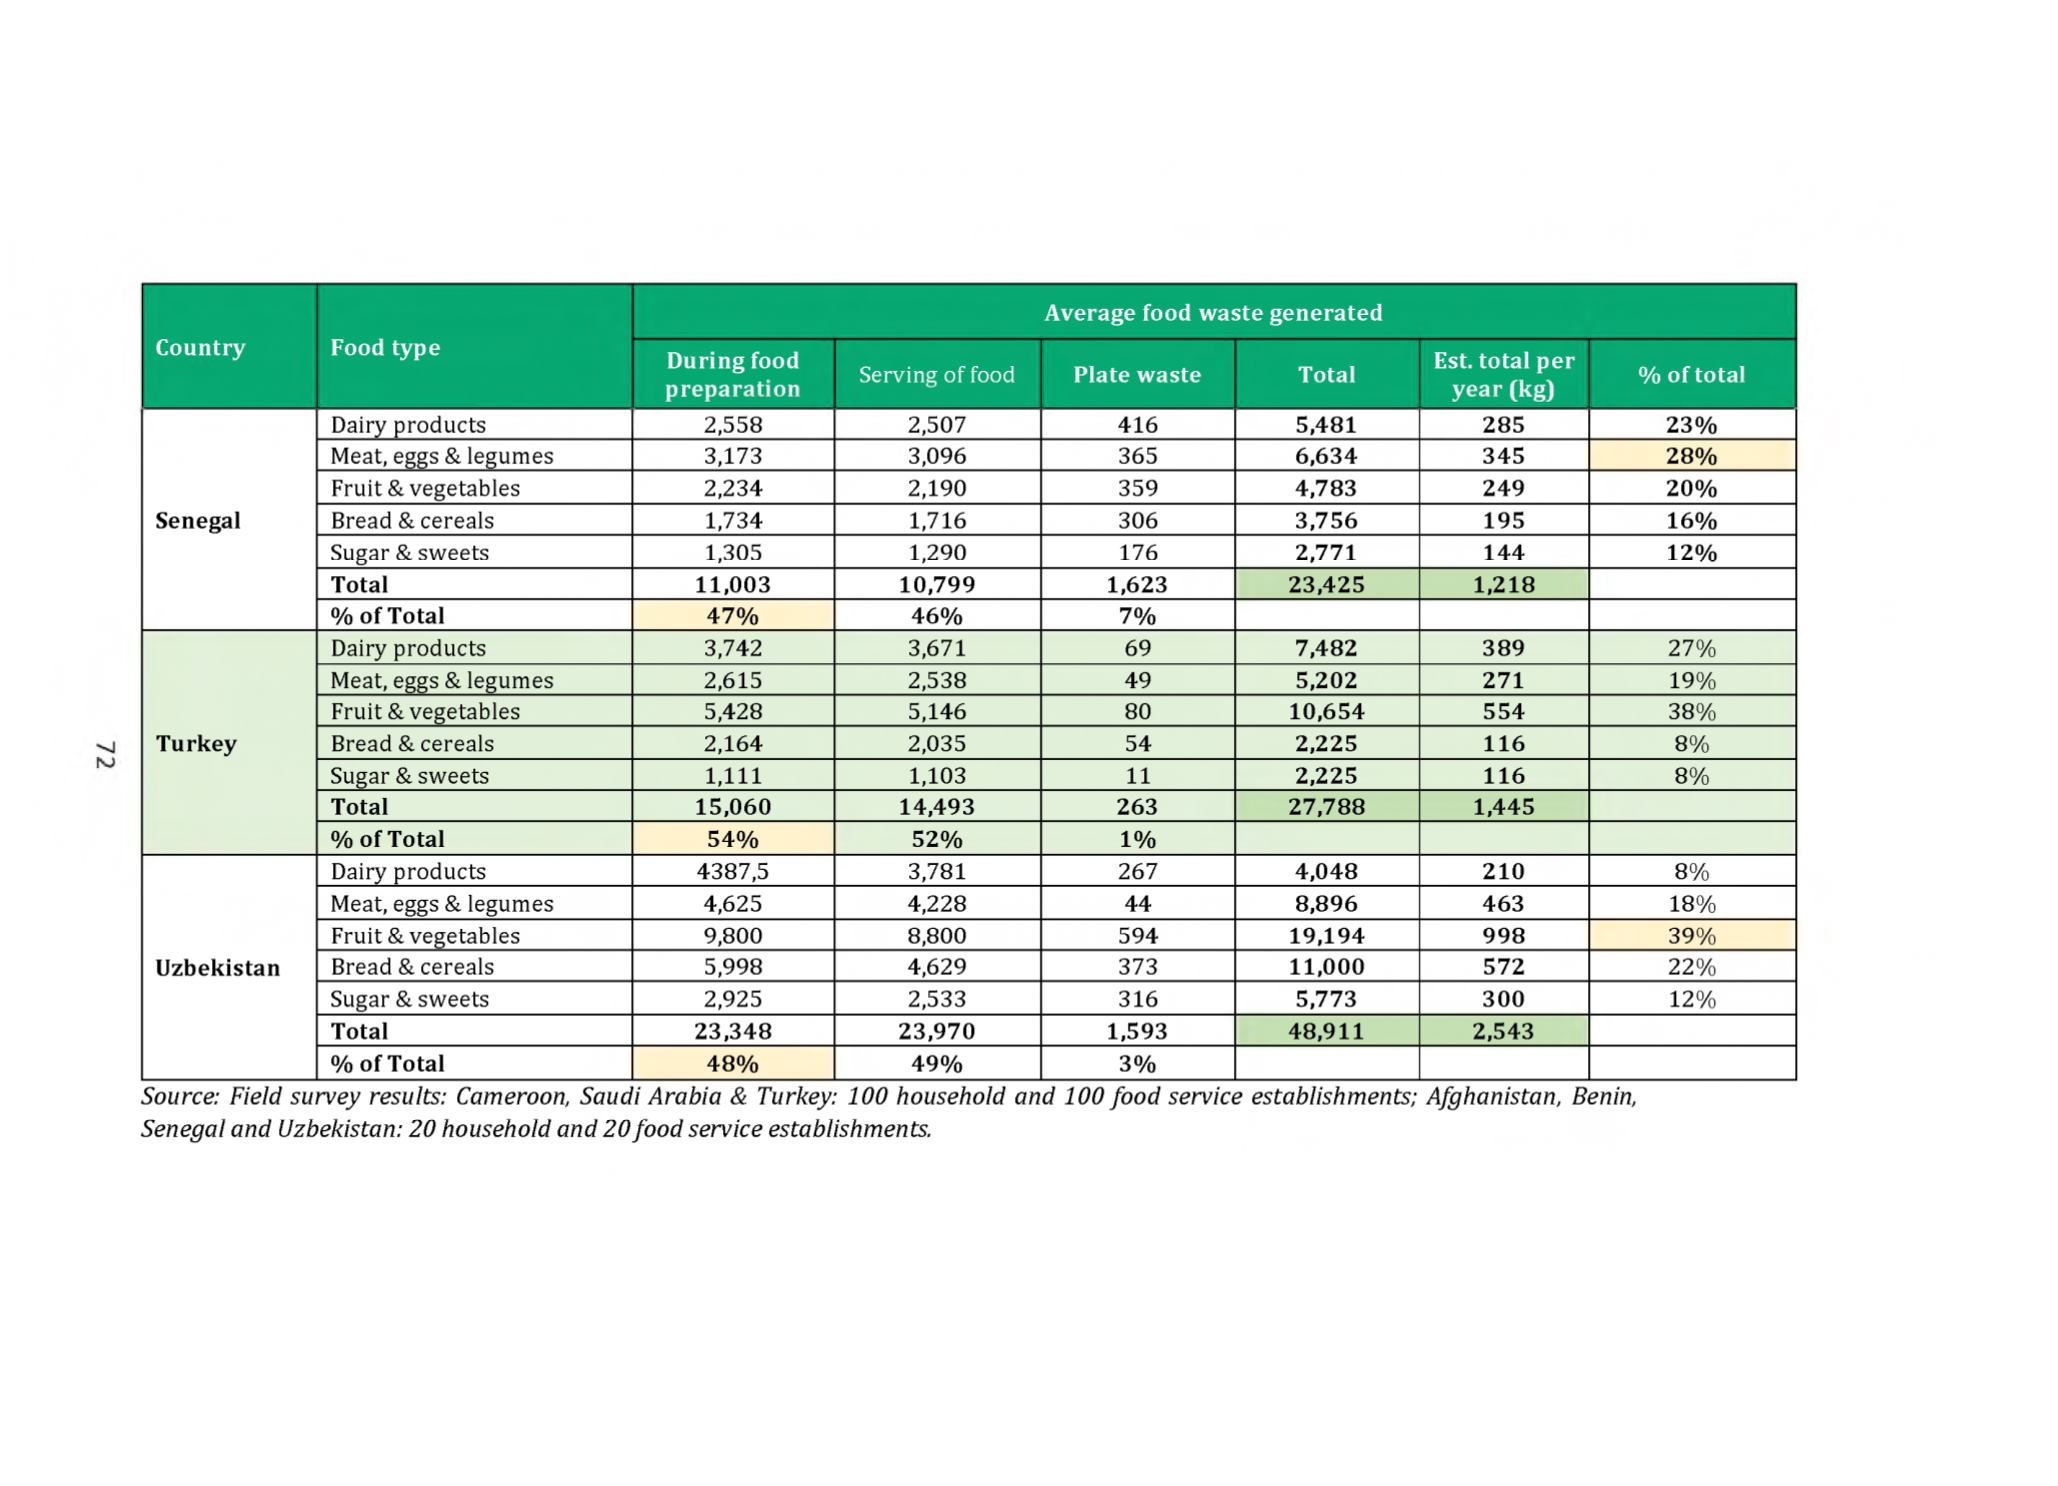
Average food waste generated
Country
Food type
During food
preparation
Serving of food
Plate waste
Total
Est. total per
year (kg)
% of total
Senegal
Dairy products
2,558
2,507
416
5,481
285
23%
Meat, eggs & legumes
3,173
3,096
365
6,634
345
28%
Fruit & vegetables
2,234
2,190
359
4,783
249
20%
Bread & cereals
1,734
1,716
306
3,756
195
16%
Sugar & sweets
1,305
1,290
176
2,771
144
12%
Total
11,003
10,799
1,623
23,425
1,218
% of Total
47%
46%
7%
Turkey
Dairy products
3,742
3,671
69
7,482
389
27%
Meat, eggs & legumes
2,615
2,538
49
5,202
271
19%
Fruit & vegetables
5,428
5,146
80
10,654
554
38%
Bread & cereals
2,164
2,035
54
2,225
116
8%
Sugar & sweets
1,111
1,103
11
2,225
116
8%
Total
15,060
14,493
263
27,788
1,445
% of Total
54%
52%
1%
Uzbekistan
Dairy products
4387,5
3,781
267
4,048
210
8%
Meat, eggs & legumes
4,625
4,228
44
8,896
463
18%
Fruit & vegetables
9,800
8,800
594
19,194
998
39%
Bread & cereals
5,998
4,629
373
11,000
572
22%
Sugar & sweets
2,925
2,533
316
5,773
300
12%
Total
23,348
23,970
1,593
48,911
2,543
% of Total
48%
49%
3%
Source: Field survey results: Cameroon, Saudi Arabia & Turkey: 100 household and 100 food service establishments; Afghanistan, Benin,
Senegal and Uzbekistan: 20 household and 20food service establishments.