


 54 / 213

Reducing Food Waste
In the OIC Member Countries
COMCEC
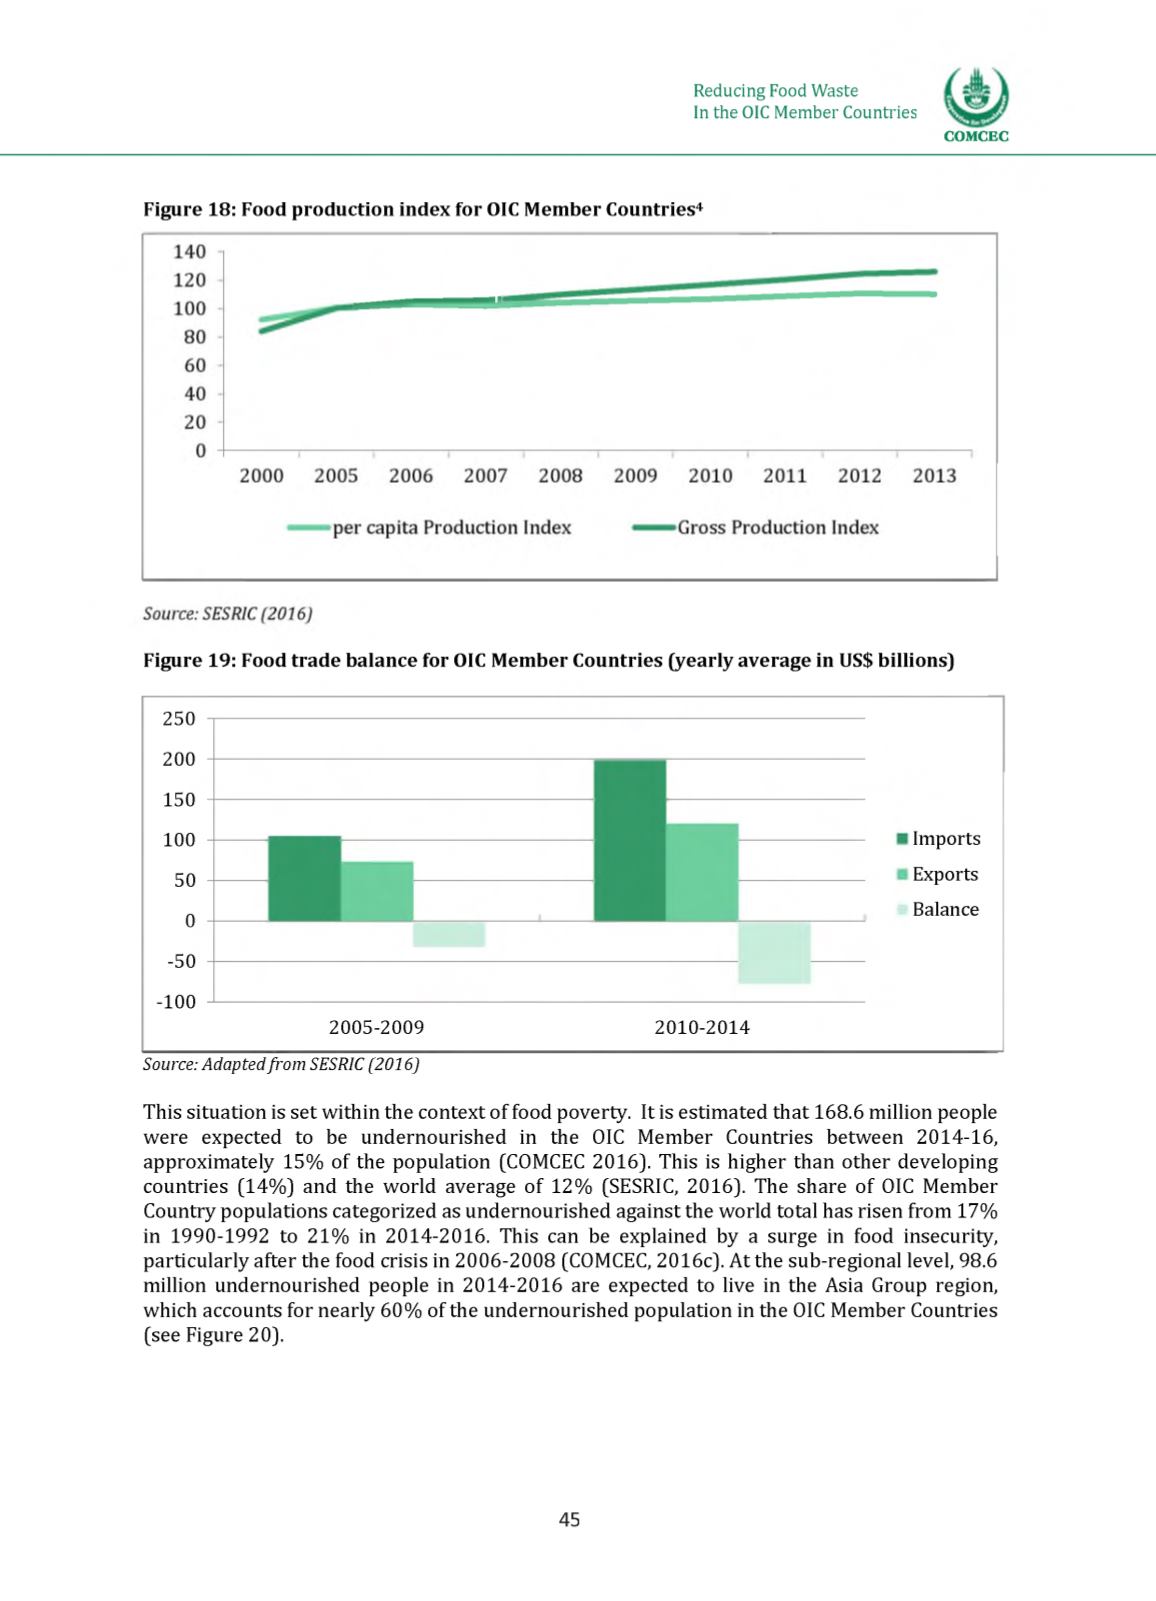
Figure 18: Food production index for OIC Member Countries4
Figure 19: Food trade balance for OIC Member Countries (yearly average in US$ billions)
250
200
150
100
50
0
-50
-100
Imports
Exports
Balance
2005-2009
2010-2014
Source: Adaptedfrom SESRIC (2016)
This situation is set within the context of food poverty. It is estimated that 168.6 million people
were expected to be undernourished in the OIC Member Countries between 2014-16,
approximately 15% of the population (COMCEC 2016). This is higher than other developing
countries (14%) and the world average of 12% (SESRIC, 2016). The share of OIC Member
Country populations categorized as undernourished against the world total has risen from 17%
in 1990-1992 to 21% in 2014-2016. This can be explained by a surge in food insecurity,
particularly after the food crisis in 2006-2008 (COMCEC, 2016c). At the sub-regional level, 98.6
million undernourished people in 2014-2016 are expected to live in the Asia Group region,
which accounts for nearly 60% of the undernourished population in the OIC Member Countries
(see Figure 20).
45