


 27 / 213

Reducing Food Waste
In the OIC Member Countries
COMCEC
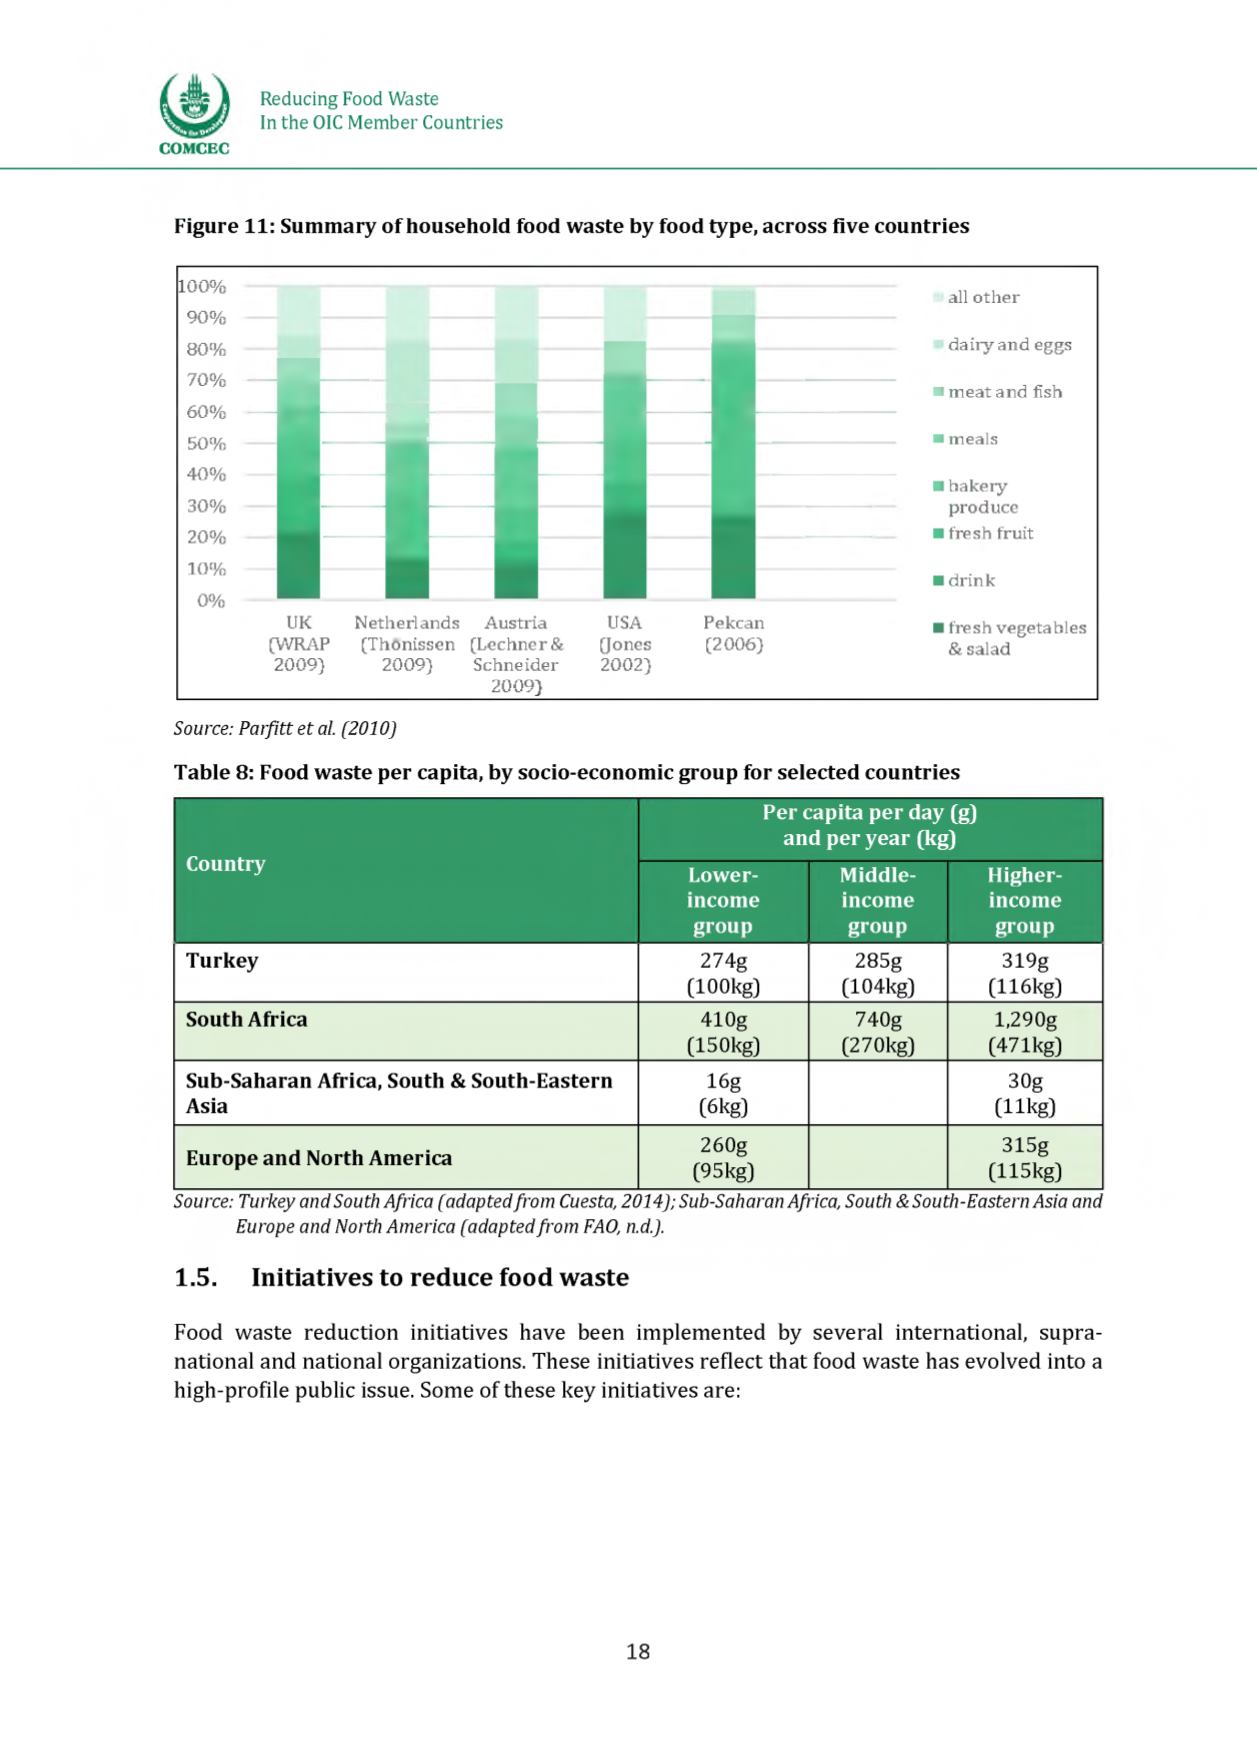
Figure 11: Summary of household food waste by food type, across five countries
all other
dairy and eggs
■meat and fish
■meals
■bakery
produce
■fresh fruit
■drink
■fresh vegetables
& salad
Source: Parfitt et al. (2010)
Table 8: Food waste per capita, by socio-economic group for selected countries
Per capita per day (g)
and per year(kg)
Country
Lower-
income
group
Middle-
income
group
Higher-
income
group
Turkey
274g
(100kg)
285g
(104kg)
319g
(116kg)
South Africa
410g
(150kg)
740g
(270kg)
1,290g
(471kg)
Sub-Saharan Africa, South & South-Eastern
Asia
16g
(6kg)
30g
(11kg)
Europe and North America
260g
(95kg)
315g
(115kg)
Source: Turkey andSouth Africa (adaptedfrom Cuesta, 2014); Sub-Saharan Africa, South &South-Eastern Asia and
Europe and North America (adaptedfrom FAO, n.d.).
1.5. In it ia tiv e s to re d u c e fo o d w a s te
Meeh waste reduction initiatives have b ttn implemented by ctvtral international, supra
national anh national organizations. Thtct initiatives reflect that feeh waste has tvelvth into a
high-prefilt public issue. Semt of these kty initiatives art:
100
%
90%
80%
70%
60%
50%
40%
30%
20
%
10
%
0
%
III
UK
Netherlands Austria
USA
Pekcan
[WRAP (Thonissen (Lechner&
(Jones
(2006)
2009)
2009)
Schneider
2002)
2009)
18