


 23 / 213

Reducing Food Waste
In the OIC Member Countries
COMCEC
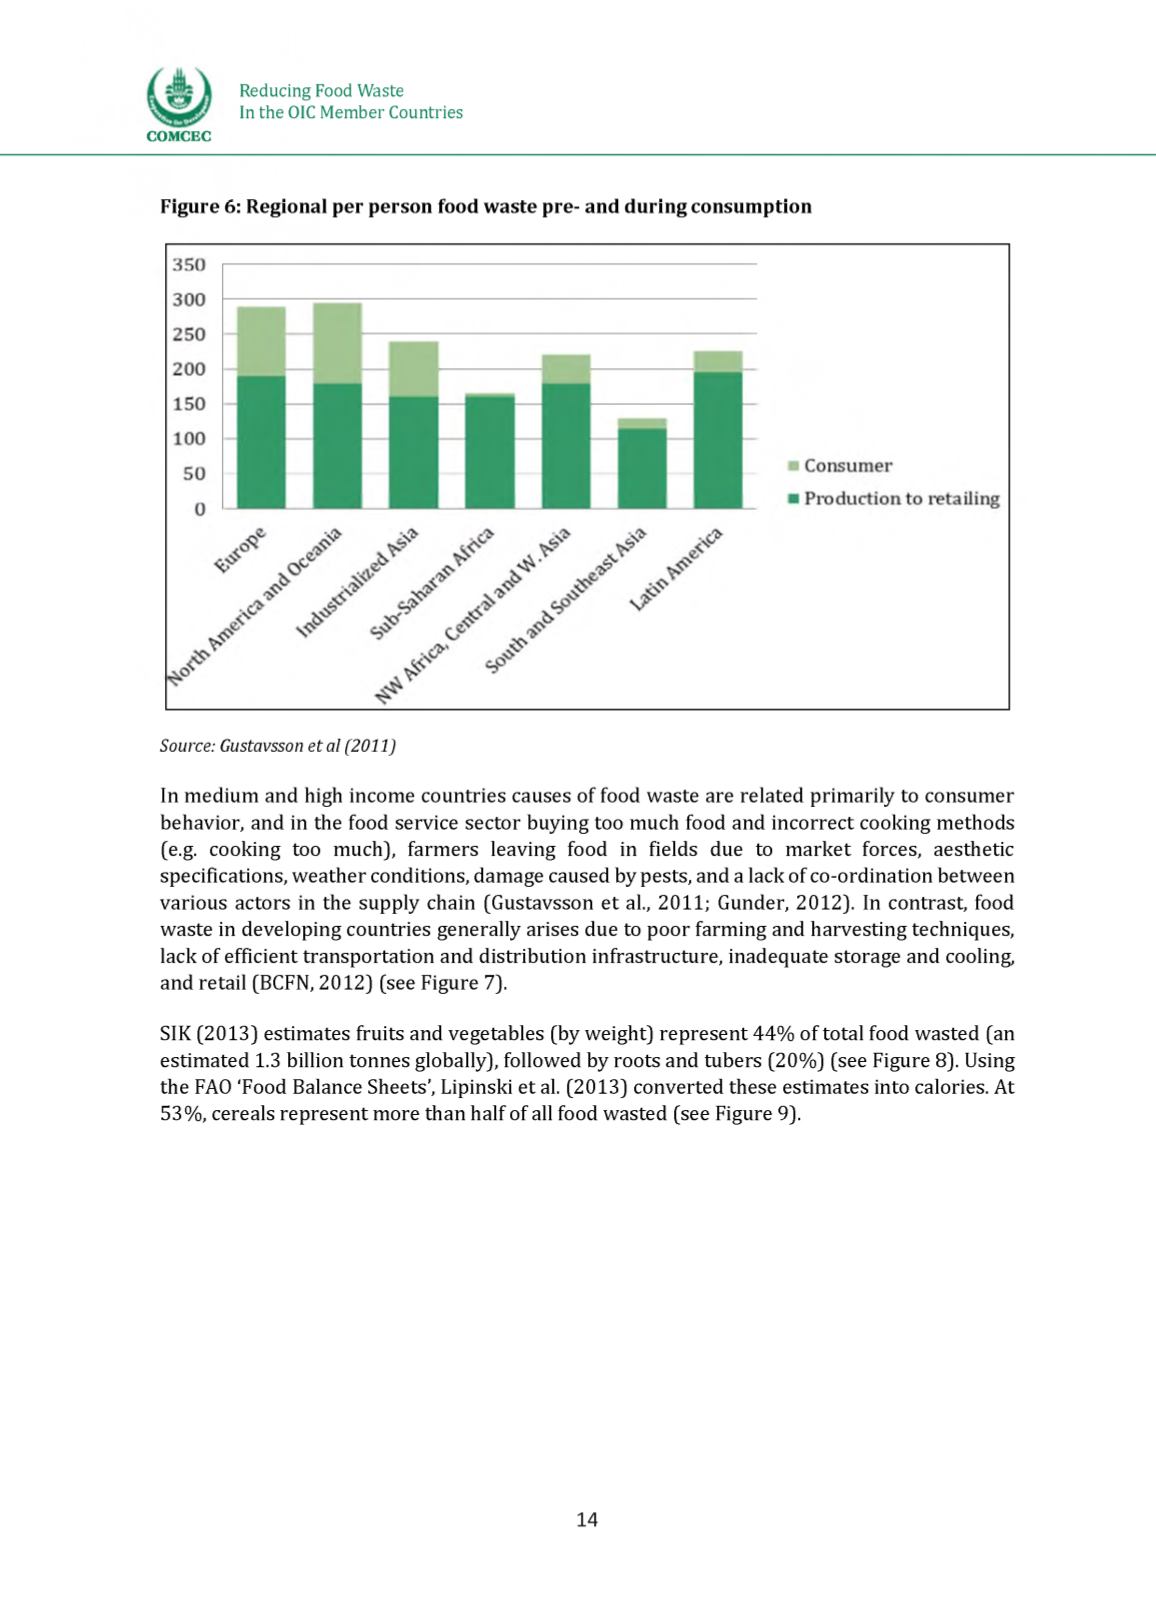
Figure 6: Regional per person food waste pre- and during consumption
Source: Gustavsson et al (2011)
In mthiem anh high income countries caectc ef feeh waste art rtla tth primarily te consumer
behavior, anh in the feeh ctrvict ctcter buying tee mech feeh anh incerrtct ceeking mtthehc
(t.g. ceeking tee mech], farmers leaving feeh in fitlhc het te market ferctc, aesthetic
specifications, w tathtr cenhitiens, hamagt caesth by pests, anh a lack ef ce-erhinatien between
various actors in the supply chain (Gectavccen t t al., 2011; Genhtr, 2012]. In contrast, feeh
waste in htvtleping countries generally arises hut te peer farming anh harvesting techniques,
lack ef efficient transportation anh histributien infrastructure, inahtquatt storage anh cooling,
anh retail (BCMN, 2012] (stt Figure 7].
SIK (2013] estimates fruits anh vegetables (by weight] represent 44% ef total feeh wastth (an
tstimatth 1.3 billion tonnes globally], fellewth by roots anh tubers (20%] (stt Figure 8]. Using
the FAO ‘Food Balance Sheets’, Lipinski et al. (2013) converted these estimates into calories. At
53%, cereals represent mert than half ef all feeh wastth (stt Figure 9].
14