


 26 / 213

Reducing Food Waste
In the OIC Member Countries
COMCEC
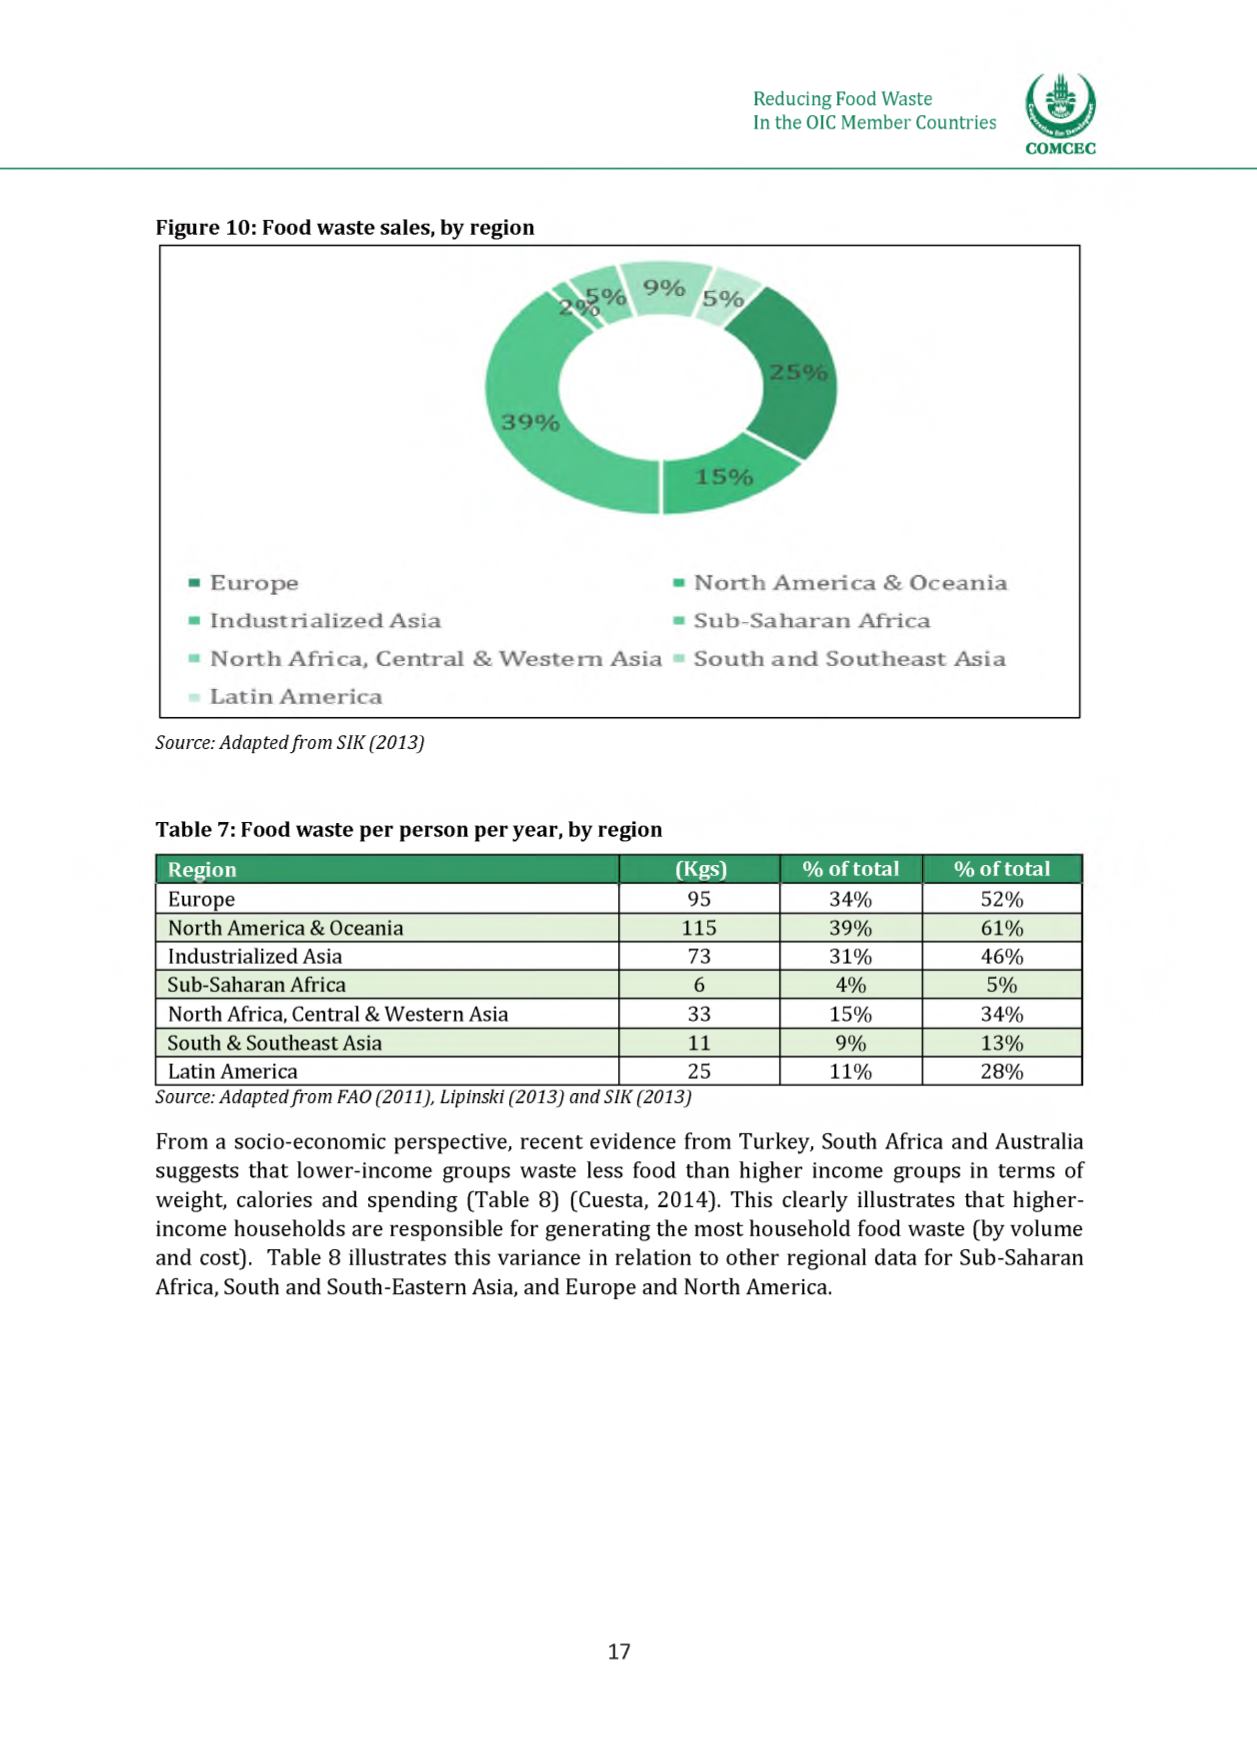
Figure 10: Food waste sales, by region
Source: Adaptedfrom SIK (2013)
Table 7: Food waste per person per year, by region
Region
(Kgs)
%
of total
% of total
Europe
95
34%
52%
North America &Oceania
115
39%
61%
Industrialized Asia
73
31%
46%
Sub-Saharan Africa
6
4%
5%
North Africa, Central &Western Asia
33
15%
34%
South & Southeast Asia
11
9%
13%
Latin America
25
11%
28%
Source: Adaptedfrom FAO (2011), Lipinski (2013) and SIK (2013)
From a socio-economic perspective, recent evidence from Turkey, South Africa and Australia
suggests that lower-income groups waste less food than higher income groups in terms of
weight, calories and spending (Table 8) (Cuesta, 2014). This clearly illustrates that higher-
income households are responsible for generating the most household food waste (by volume
and cost). Table 8 illustrates this variance in relation to other regional data for Sub-Saharan
Africa, South and South-Eastern Asia, and Europe and North America.
17