


 22 / 213

Reducing Food Waste
In the OIC Member Countries
COMCEC
Table 6: Variations in the classification of food waste
Sub-category
Langley
et al
(2010)
Schneider &
Obersteiner
(2007)
WRAP
(2009)
Preparation residues
Unavoidable
Unavoidable
Unavoidable or
possibly avoidable
Post-preparation and
consumption residues
Avoidable
Partly avoidable
Avoidable or
possibly avoidable
Post consumed food
Avoidable
Avoidable
Avoidable
Whole unused food
Avoidable
Avoidable
Avoidable
Source: Adaptedfrom Parfitt (2016)
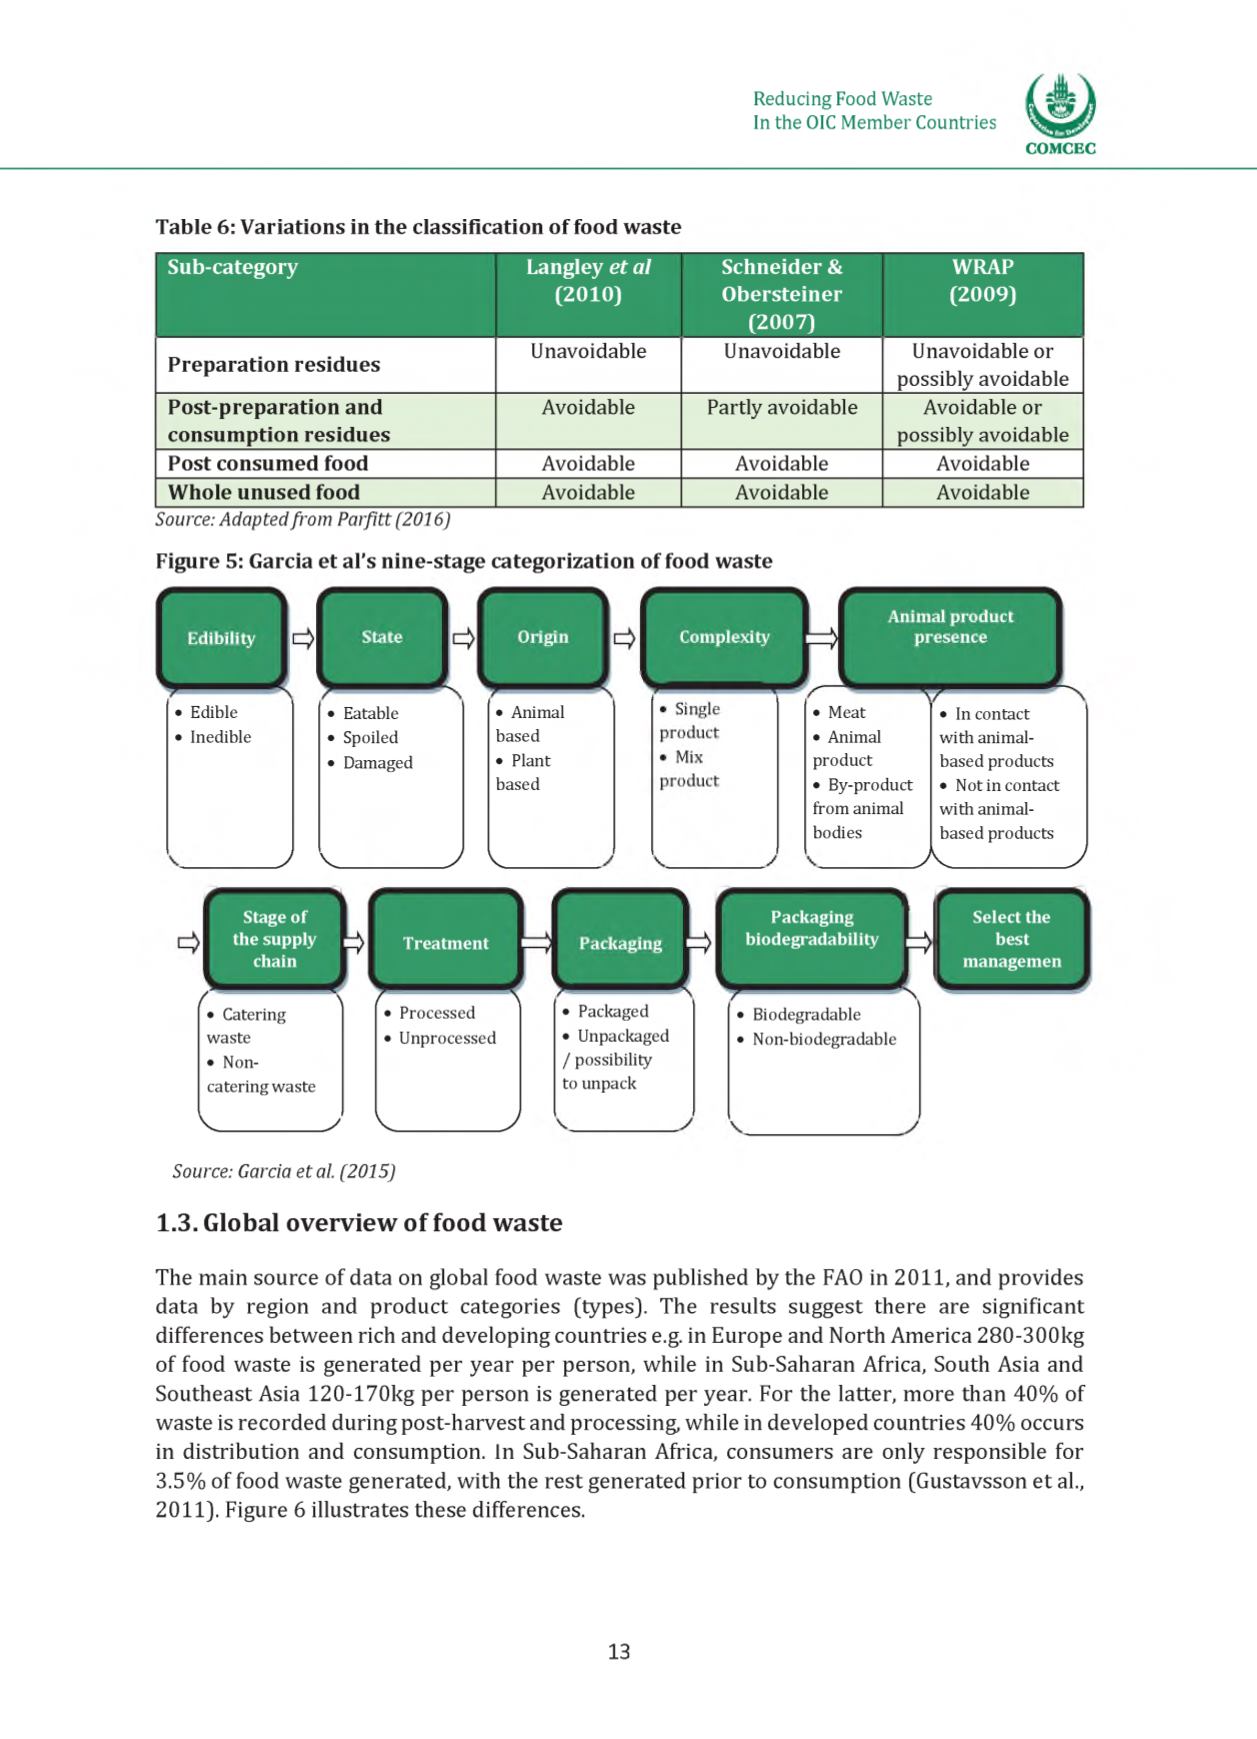
Figure 5: Garcia et al's nine-stage categorization of food waste
• Edible
• Inedible
• Eatable
• Spoiled
• Damaged
J
V
• Animal
based
• Plant
based
J
V
• Meat
• Animal
product
• By-product
from animal
bodies
• In contact
with animal
based products
• Not in contact
with animal
based products
yv_______/
r
"
Stage of
the supply
chain
Treatment
f
\
/
\
• Catering
• Processed
waste
• Unprocessed
• Non
cateringwaste
V
V V
J
• Packaged
• Unpackaged
/ possibility
to unpack
r
Packaging
biodegradability
N
r
^
Select the
best
managemen
>>
• Biodegradable
• Non-biodegradable
Source: Garcia et al. (2015)
1.3. Global overview of food waste
The main source of data on global food waste was published by the FAO in 2011, and provides
data by region and product categories (types). The results suggest there are significant
differences between rich and developing countries e.g. in Europe and North America 280-300kg
of food waste is generated per year per person, while in Sub-Saharan Africa, South Asia and
Southeast Asia 120-170kg per person is generated per year. For the latter, more than 40% of
waste is recorded during post-harvest and processing, while in developed countries 40% occurs
in distribution and consumption. In Sub-Saharan Africa, consumers are only responsible for
3.5% of food waste generated, with the rest generated prior to consumption (Gustavsson et al.,
2011). Figure 6 illustrates these differences.
13