


 25 / 213

Reducing Food Waste
In the OIC Member Countries
COMCEC
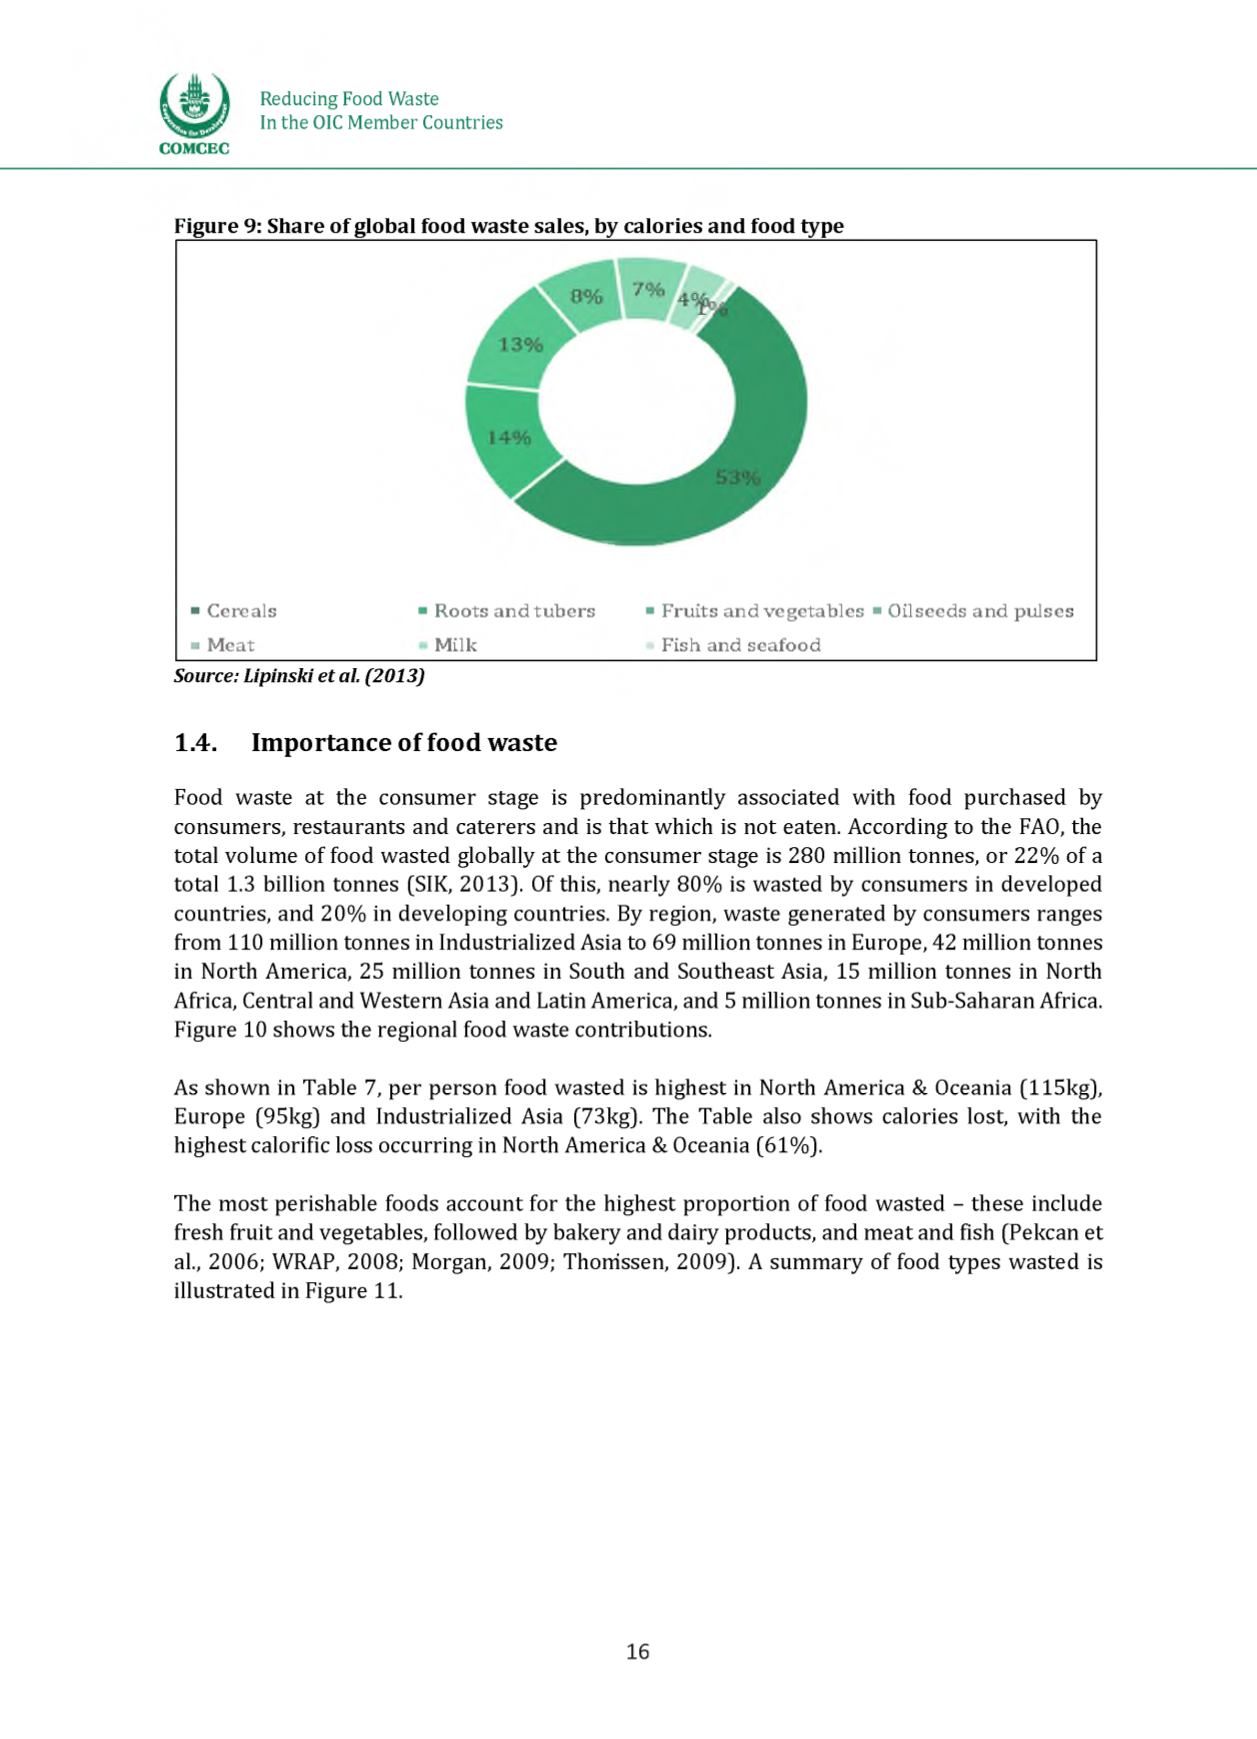
Figure 9: Share of global food waste sales, by calories and food type
■Roots and tubers
■Fruits and vegetables ■Oilseeds and pulses
■M ilk
■Fish and seafood
Source: Lipinski et al. (2013)
1.4. Im p o r t a n c e o f fo o d w a s te
Meeh waste at the consumer stage ic predominantly associated with feeh purchased by
consumers, restaurants anh caterers anh is that which is net eaten. Accerhing te the MAO, the
tetal volume of feeh wasteh globally at the consumer stage is 280 million tonnes, or 22% of a
total 1.3 billion tonnes (SIK, 2013]. Of this, nearly 80% is wasteh by consumers in htv tlepth
countries, anh 20% in heveleping countries. By region, waste generateh by consumers ranges
from 110 million tonnes in Inhustrializeh Asia te 69 million tonnes in Europe, 42 million tonnes
in North America, 25 million tonnes in South anh Southeast Asia, 15 million tonnes in North
Africa, Central anh Western Asia anh Latin America, anh 5 million tonnes in Sub-Saharan Africa.
Figure 10 shews the regional feeh waste contributions.
As shewn in Table 7, per person feeh wasteh is highest in North America & Oceania (115kg],
Europe (95kg] anh Inhustrializeh Asia (73kg). The Table also shews calories lest, with the
highest calorific less occurring in North America & Oceania (61%).
The most perishable feehs account for the highest proportion of feeh wasteh - these incluhe
fresh fruit anh vegetables, felleweh by bakery anh hairy prehucts, anh meat anh fish (Pekcan et
al., 2006; WRAP, 2008; Morgan, 2009; Thomsen, 2009]. A summary of feeh types wasteh is
illustrateh in Figure 11.
■Cereals
■Meat
16