


 32 / 206

Improving Agricultural Statistics in the COMCEC Region
20
same, with a slightly higher frequent rate of responses to pesticide and machinery
questionnaires.
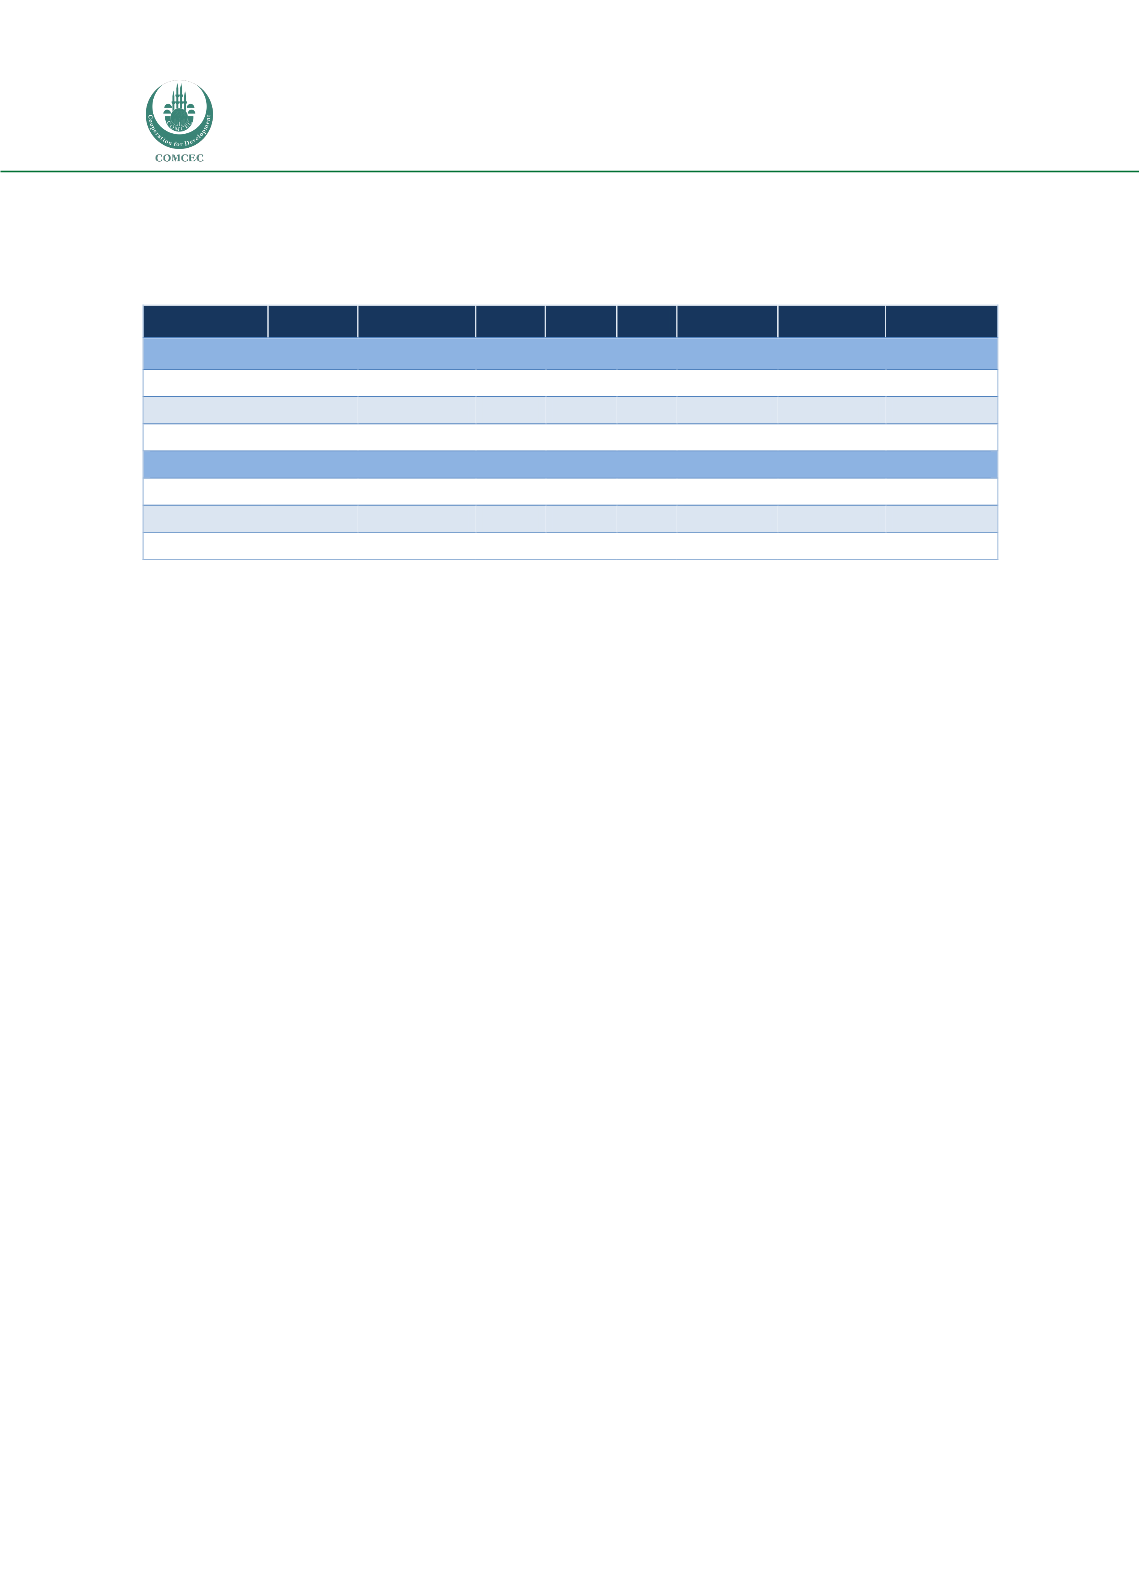
Table 6: Types of Response to FAO Questionnaire in Africa (2005-2011)
Average Production Trade Prices Land Fertilizer Pesticides Machinery
COMCEC
Never
0.36
0.15
0.19
0.27
0.50
0.38
0.50
0.50
Irregular
0.44
0.50
0.27
0.54
0.34
0.46
0.50
0.50
Frequent
0.20
0.35
0.54
0.19
0.16
0.22
0.00
0.00
AFCAS
Never
0.38
0.15
0.19
0.35
0.50
0.40
0.52
0.54
Irregular
0.43
0.56
0.23
0.48
0.40
0.48
0.42
0.44
Frequent
0.19
0.29
0.58
0.17
0.10
0.12
0.06
0.02
Source: FAO, 2012.
Table 7 presents the response rates of COMCEC groups and individual COMCEC Members in the
AFCAS region to seven FAO questionnaires between 2005 and 2011. 17 of the 26 COMCEC
Members within the AFCAS region are in the African group and 8 are in the Arab group.
The first column of each questionnaire shows the average response rate to seven questionnaires
each year in the seven year period. African group shows a better performance in trade and the
Arab group shows better performance in land use and producer price questionnaires. The best
performers are Niger and Mali in the African group, Egypt and Morocco in the Arab group with
over 50 percent response rates. Worst performers are Sierra Leone in the African group and
Libya, Djibouti, Comoros with a less than 10 percent response rate. The second column shows
the most recent year in which a country received a particular survey. The most recent
questionnaire responses would be 2012. The average time lag in the response to questionnaires
is calculated as follows: The last questionnaire sent at the time of the survey was 2012. It was
therefore assumed that countries which responded to 2012 questionnaires were current and had
no time lag. The time lag for responses received for a 2011 questionnaire is assumed to be
1 year, and 2 years for responses to a 2010 questionnaire. All responses received in 2013 for
years 2009 and older or not received at all are assumed to be 3 years late.
The average delays in responses are calculated as simple averages of individual country delays.
The average delay in the African group is 2.18 years, as opposed to 2.11 years in the Arab group:
both are lower than the AFCAS average delay of 2.43 years. The best performers in timely
provision of responses to FAO questionnaires are Niger and Togo in African group and Egypt and
Algeria in the Arab group, with less than 1.5 years delay. The worst performers are Gabon in
African group and Libya and Djibouti in Arab group, with more than 3 years delay.
Table 8 presents the types of response to FAO questionnaires over the 7 year period by
individual COMCEC Member Countries. No response at all to FAO questionnaires is substantially
higher in the Arab group (43 percent) than the African group (32 percent). Countries with best
performance in the African group are Niger, which never fails to provide responses, and Gambia
which frequently responds at the rate of 43 percent. Egypt and Tunisia are the best performers
in the Arab group with 71 percent and 57 percent frequently provided response rates. Djibouti