
Improving Agricultural Statistics in the COMCEC Region
25
Member Countries. The COMCEC average is significantly lower at 29 percent. There is virtually
no difference between the African and the Arab groups. The low percentage is alarming in the
sense that more than two thirds of the data presented in FAOSTAT for COMCEC Member
Countries in Africa are FAO estimates.
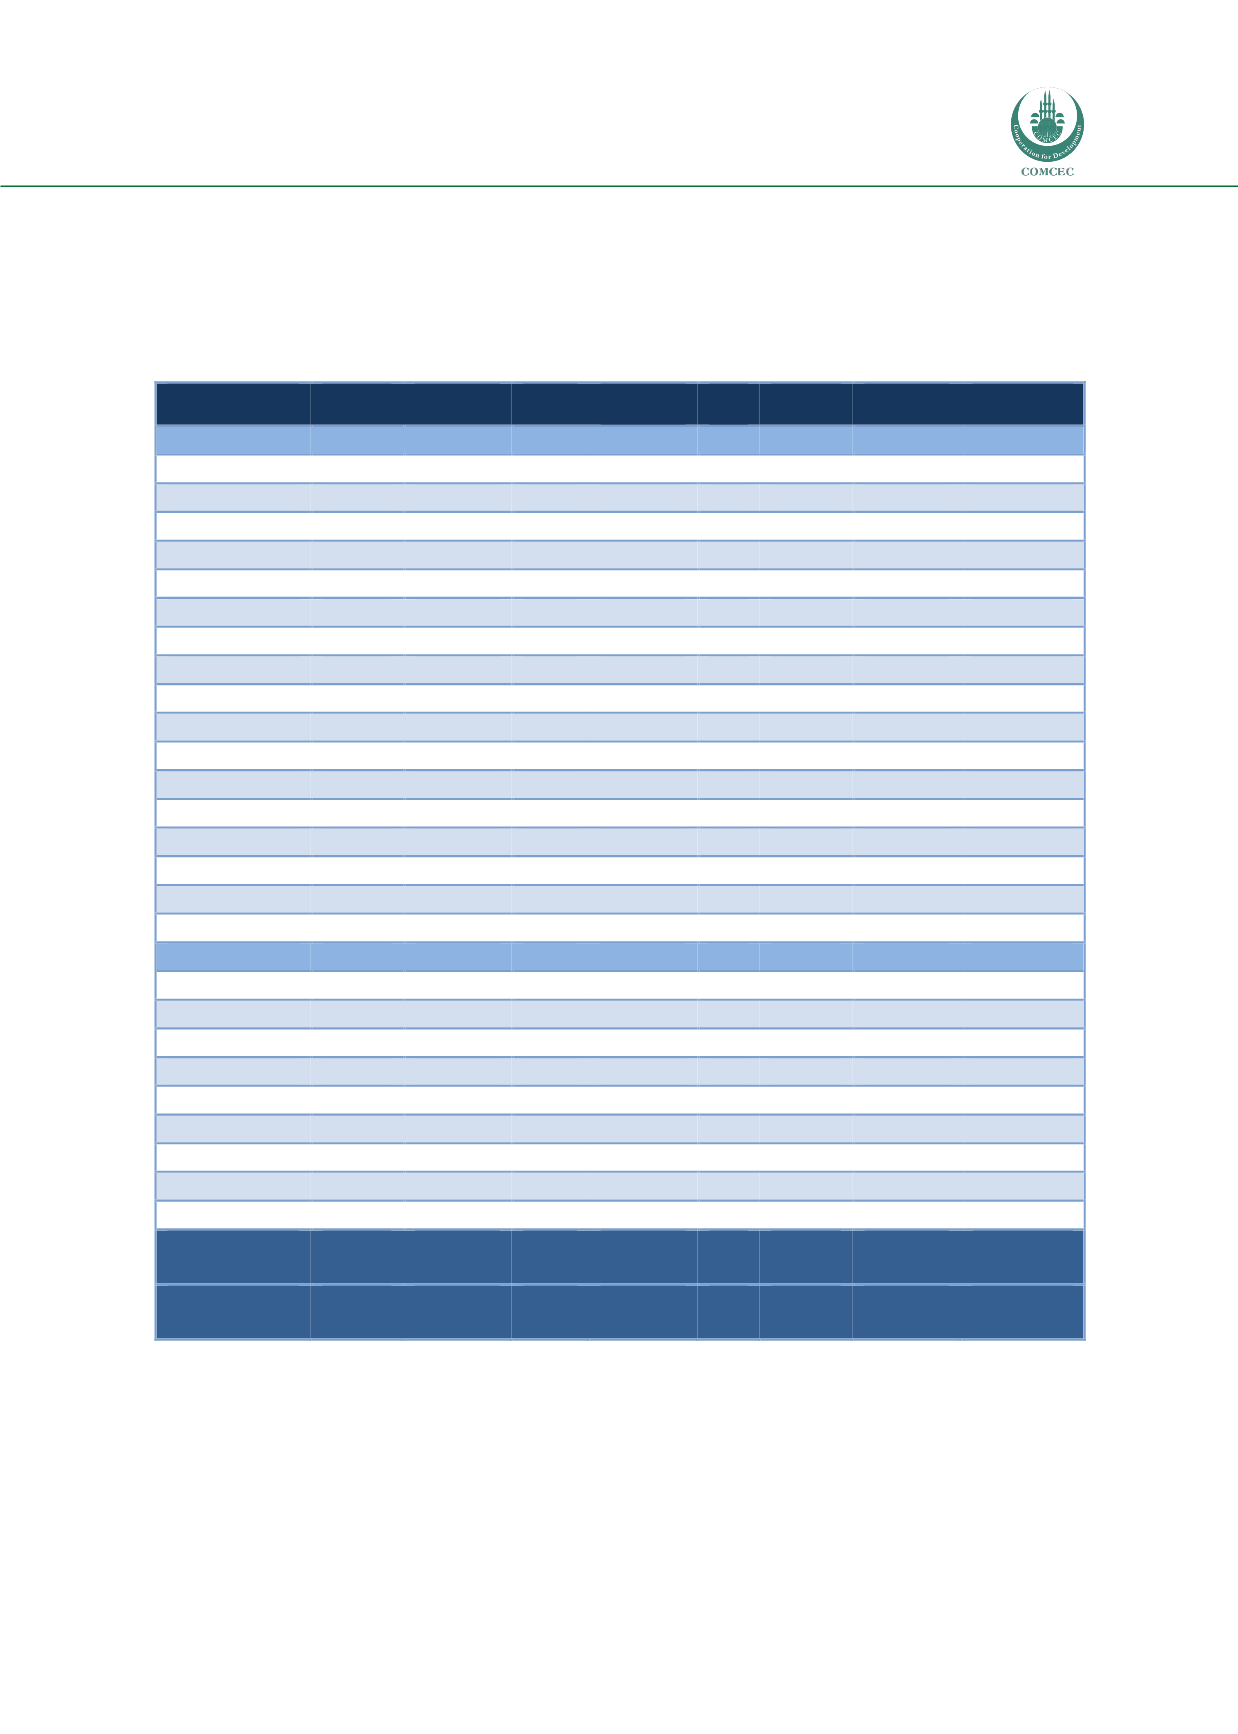
Table 12: Average Percentage of Official Records in FAOSTAT in Africa (2005-2011)
Average
Production
Trade
Producer
Prices
Land
Use
Fertilizer
Pesticides
Machinery
African Group
28
32
35
23
27
10
22
48
Benin
21
44
43
36
24
3
-
-
Burkina Faso
41
38
30
26
25
3
62
100
Cameroon
40
32
57
11
37
39
52
53
Chad
10
13
4
33
20
0
-
-
Côte d'Ivoire
27
47
70
32
22
18
-
-
Gabon
9
1
22
-
32
6
-
-
Gambia
33
29
47
0
44
13
40
60
Guinea
11
17
12
10
16
7
14
-
Guinea-Bissau
9
18
2
28
17
-
-
Mali
50
47
41
36
25
9
93
100
Mozambique
26
28
1
21
36
8
0
88
Niger
40
41
52
22
54
8
33
68
Nigeria
30
39
16
20
24
10
-
100
Senegal
47
63
74
80
30
18
-
64
Sierra Leone
3
13
1
-
6
0
-
-
Togo
45
31
51
30
17
6
88
93
Uganda
37
40
69
-
37
15
-
97
Arab Group
29
34
32
23
51
9
20
31
Algeria
57
61
54
36
72
17
57
100
Comoros
12
0
0
29
0
57
Djibouti
5
8
1
24
Egypt
48
58
57
63
55
10
90
Libya
6
9
1
29
6
Mauritania
18
19
48
29
29
Morocco
38
55
57
35
71
26
25
Sudan
26
60
10
35
71
3
Tunisia
48
39
57
40
83
15
10
92
COMCEC
Average
29
33
34
23
36
9
22
43
AFCAS
Average
35
38
46
36
33
11
25
53
Source: FAO, 2013a.
The best performers are Mali in the African group and Algeria in the Arab group, which are the
only countries with equal to or more than 50 percent official data in FAOSTAT. Worst
performers are Gabon, Guinea, Guinea-Bissau and Sierra Leone in the African group, and
Dijibouti and Libya in the Arab group with less than 10 percent official data in FAOSTAT.


