


 33 / 206

Improving Agricultural Statistics in the COMCEC Region
21
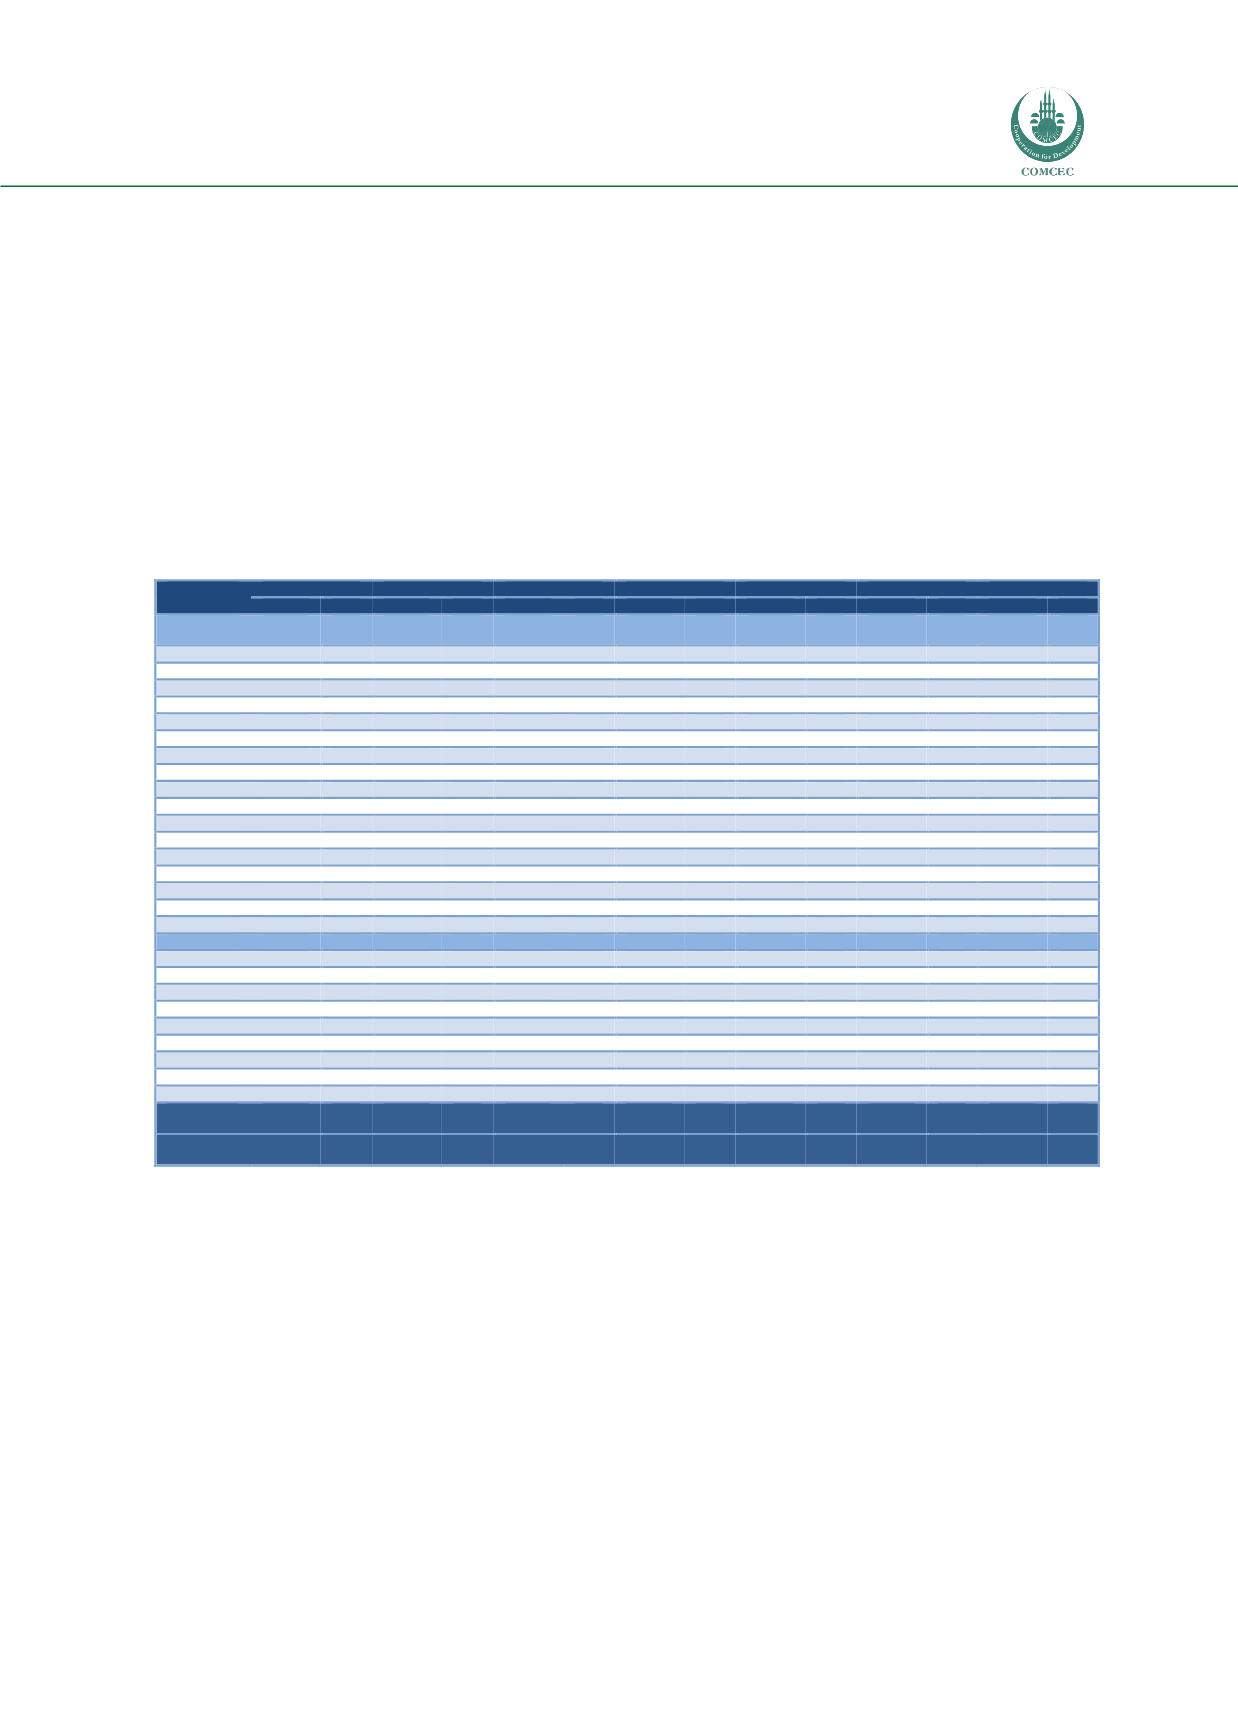
and Libya are the worst performers, providing 100 percent no responses, followed by Comoros
with an 86 percent no response rate. Table 9 summarizes the responses to FAO questionnaires
by 50 Asian countries, 27 of which are COMCEC Members, 15 from the Asian group and 12
from the Arab group. The response rates by Asian countries are substantially higher than
African countries, more than double, with the exception of production, which registers a worse
performance in Asia due to the inclusion of Oceania. The COMCEC Countries in Asia also
perform significantly better than the COMCEC Members in Africa. Within the COMCEC
Members, the Asian group showed a significantly better response rate in land use and
producer prices than the Arab group, which registered a better response in pesticide
questionnaires.
Table 7: Response Ratios to FAO Questionnaires in Africa (2005-2011)
Note: Average Delay =∑ (2012*0+2011*1+2010*2+(2009 or older)*3+No Response*3)/Number of Countries
Source: Calculated from FAO, 2013a.
COUNTRIES
Production
Trade
Producer Prices
Land Use
Fertilizers
Pesticides
Machinery
Response
Delay
Response
Delay
Response
Delay
Response
Delay
Response
Delay
Response
Delay
Response
Delay
AFRICAN
GROUP
0.52
0.76
0.63
1.94
0.30
2.35
0.17
2.53
0.28
2.47
0.09
2.29
0.07
2.94
Benin
0.14
2012
0.71
2010
0.00
n.a.
0.00
1998
0.00
n.a.
0.00
n.a.
0.00
n.a.
Burkina Faso
0.43
2011
0.43
2011
0.43
2010
0.14
2008
0.29
2009
0.24
2011
0.08
2007
Cameroon
0.57
2012
1.00
2011
0.29
2007
0.29
2008
0.43
2010
0.24
2011
0.16
2010
Chad
0.29
2010
0.57
2008
0.00
n.a.
0.29
2011
0.00
n.a.
0.00
1997
0.00
n.a.
Côte d'Ivoire
0.71
2012
1.00
2011
0.57
2011
0.00
1997
0.29
2006
0.00
1996
0.00
n.a.
Gabon
0.00
n.a
0.29
2006
0.14
2007
0.00
1995
0.14
2007
0.00
n.a.
0.00
n.a.
Gambia
0.71
2012
0.71
2011
0.29
2008
0.29
2011
0.86
2011
0.08
2007
0.08
2009
Guinea
0.43
2008
0.14
2008
0.29
2008
0.00
1996
0.14
2007
0.16
2010
0.00
n.a.
Guinea-Bissau
0.57
2011
0.00
n.a
0.29
2011
0.00
1993
0.00
n.a.
0.00
2001
0.00
n.a.
Mali
1.00
2012
0.57
2008
0.86
2011
0.29
2007
0.57
2011
0.16
2011
0.08
2007
Mozambique
0.43
2012
0.43
2011
0.29
2009
0.00
n.a.
0.00
n.a.
0.08
2010
0.08
2010
Niger
0.57
2012
0.71
2011
0.43
2011
0.86
2011
0.71
2011
0.24
2011
0.16
2009
Nigeria
0.43
2011
0.71
2008
0.14
2008
0.00
1997
0.29
2009
0.00
n.a.
0.08
2007
Senegal
0.86
2012
1.00
2011
0.14
2009
0.14
2006
0.71
2011
0.00
2001
0.08
2009
Sierra Leone
0.29
2011
0.00
n.a
0.00
n.a.
0.00
1999
0.00
n.a.
0.00
n.a.
0.00
n.a.
Togo
0.43
2012
0.86
2011
0.57
2011
0.43
2011
0.00
n.a.
0.16
2011
0.16
2009
Uganda
0.43
2011
1.00
2011
0.14
2007
0.00
1997
0.00
n.a.
0.00
1995
0.08
2007
ARAB GROUP
0.52
1.11
0.52
2.00
0.43
2.00
0.33
2.22
0.25
2.11
0.07
2.33
0.05
3.00
Algeria
0.86
2012
0.86
2011
0.71
2011
0.14
2007
0.29
2011
0.16
2011
0.08
2007
Comoros
0.00
n.a
0.00
n.a
0.00
n.a.
0.00
1989
0.00
n.a.
0.08
2011
0.00
n.a.
Djibouti
0.00
n.a
0.00
n.a
0.00
n.a.
0.00
1983
0.00
n.a.
0.00
n.a.
0.00
n.a.
Egypt
0.86
2012
0.71
2011
1.00
2011
0.86
2011
0.86
2011
0.00
1993
0.16
2009
Libya
0.00
n.a
0.00
n.a
0.00
n.a.
0.00
1985
0.00
n.a.
0.00
n.a.
0.00
n.a.
Mauritania
0.57
2011
0.86
2011
0.14
2007
0.00
1998
0.00
n.a.
0.24
2011
0.00
n.a.
Morocco
0.86
2012
0.86
2010
0.86
2010
0.86
2011
0.57
2008
0.08
2007
0.00
n.a.
Sudan
0.86
2012
0.57
2009
0.43
2011
0.71
2011
0.14
2011
0.00
2000
0.00
2008
Tunisia
0.71
2012
0.86
2011
0.71
2011
0.43
2011
0.43
2010
0.08
2009
0.16
2008
COMCEC
Average
0.50
0.88
0.57
1.96
0.34
2.23
0.22
2.38
0.26
2.35
0.08
2.30
0.06
2.96
AFCAS
Average
0.40
0.60
0.30
0.20
0.24
0.19
0.17