


 36 / 206

Improving Agricultural Statistics in the COMCEC Region
24
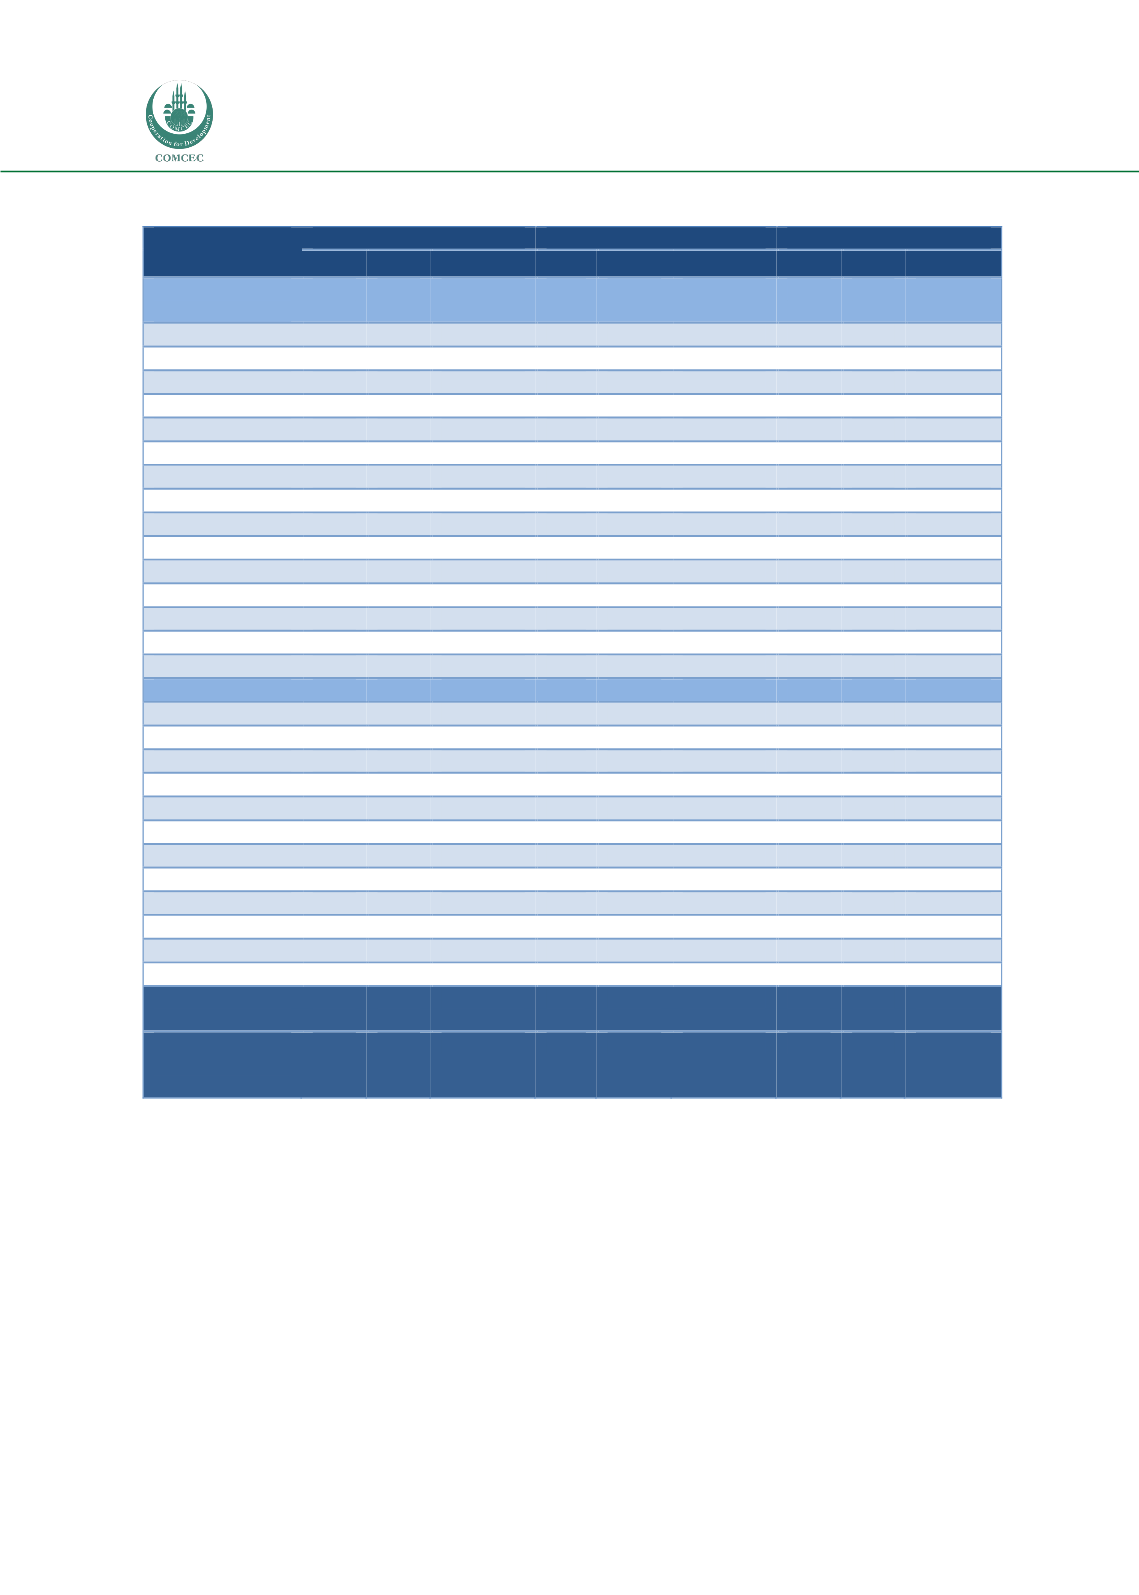
Table 11: Ratios and Types of Response to FAO Questionnaires in Asia (2008-2011)
Land Use
Producer Price
Pesticides
Ratio
Last
Type
Ratio
Last
Type
Ratio
Last
Type
ASIAN GROUP
(15)
0.55
1.20
20/47/33
0.60
0.87
20/27/53
0.16
1.87
53/13/34
Afghanistan
1.00
2011
F
0.60
2011
I
0.00
-
N
Azerbaijan
1.00
2011
F
1.00
2011
F
1.00
2011
F
Bangladesh
0.60
2010
I
0.40
2011
I
1.00
2011
F
Brunei
0.00
-
N
0.00
-
N
0.00
-
N
Indonesia
0.20
2010
I
0.80
2011
F
0.00
-
N
Iran
1.00
2011
F
1.00
2011
F
0.67
2011
F
Kazakhstan
0.40
2009
I
0.80
2010
F
0.33
2008
I
Kyrgyzstan
1.00
2011
F
1.00
2011
F
1.00
2011
F
Malaysia
0.60
2011
I
0.80
2011
F
0.33
2010
I
Maldives
0.60
2009
I
0.20
2008
I
0.00
-
N
Pakistan
0.20
2009
I
0.60
2011
I
0.00
-
N
Tajikistan
0.60
2010
I
0.80
2011
F
0.00
-
N
Turkey
1.00
2011
F
1.00
2011
F
0.67
2011
F
Turkmenistan
0.00
-
N
0.00
-
N
0.00
-
N
Uzbekistan
0.00
-
N
0.00
-
N
0.00
-
N
ARAB GROUP (12)
0.23
1.17
25/33/42
0.27
1.00
25/33/42
0.25
1.33
17/25/58
Bahrain
0.00
-
N
0.20
2009
I
0.33
2008
I
Iraq
0.40
2010
I
0.20
2010
I
0.33
2008
I
Jordan
0.80
2011
F
1.00
2011
F
1.00
2011
F
Kuwait
0.00
-
N
0.00
-
N
-
N
Lebanon
0.20
2008
I
0.40
2011
I
-
N
Palestine
0.80
2011
F
1.00
2011
F
0.67
2010
F
Oman
0.20
2010
I
0.00
-
N
0.67
2011
F
Qatar
0.20
2011
I
0.00
-
N
0.67
2011
F
Saudi Arabia
0.00
-
N
0.40
2011
I
0.33
2008
I
Syria
1.00
2011
F
0.80
2011
F
0.00
-
N
UAE
0.20
2011
I
0.00
-
N
0.00
-
N
Yemen
0.60
2011
I
0.60
2011
I
0.67
2011
F
Total COMCEC
Average (27)
0.54
1.12
22/48/30
0.61
0.73
26/30/44
0.37
2.23
44/19/36
Total Asia
Average
(50/49/50)
0.49
1.22
18/50/32
0.58
0.70
21/39/40
0.35
1.90
48/26/26
Notes: 1. Land Use and Producer Prices responses are for the 2007-2011 period. Pesticide responses are for
2008, 2010, 2011. 2. F=Frequent Response: R≥4, I=Irregular Response: 3≥R≥0 and N= No Response: R=0 for
Land Use and Producer Prices and F: R≥2, I: 1≥R≥0 and N: R=0 for Pesticides. 3. For average delay of
responses 2011=0, 2010=1, 2009=2, 2008 and earlier =3 years of delay.
Source: FAO, 2012.
Kuwait in the Arab group are the worst performers with no return of any questionnaires. 50
Asian countries and 27 COMCEC Members in Asia show similar questionnaire return
performance rates.
Another way to look at the supply of countries to the international databases in agricultural
statistics is to analyze the proportion of official records in FAOSTAT coming from member
countries. The average rate of official records in the seven domains is 35 percent in AFCAS