


 34 / 206

Improving Agricultural Statistics in the COMCEC Region
22
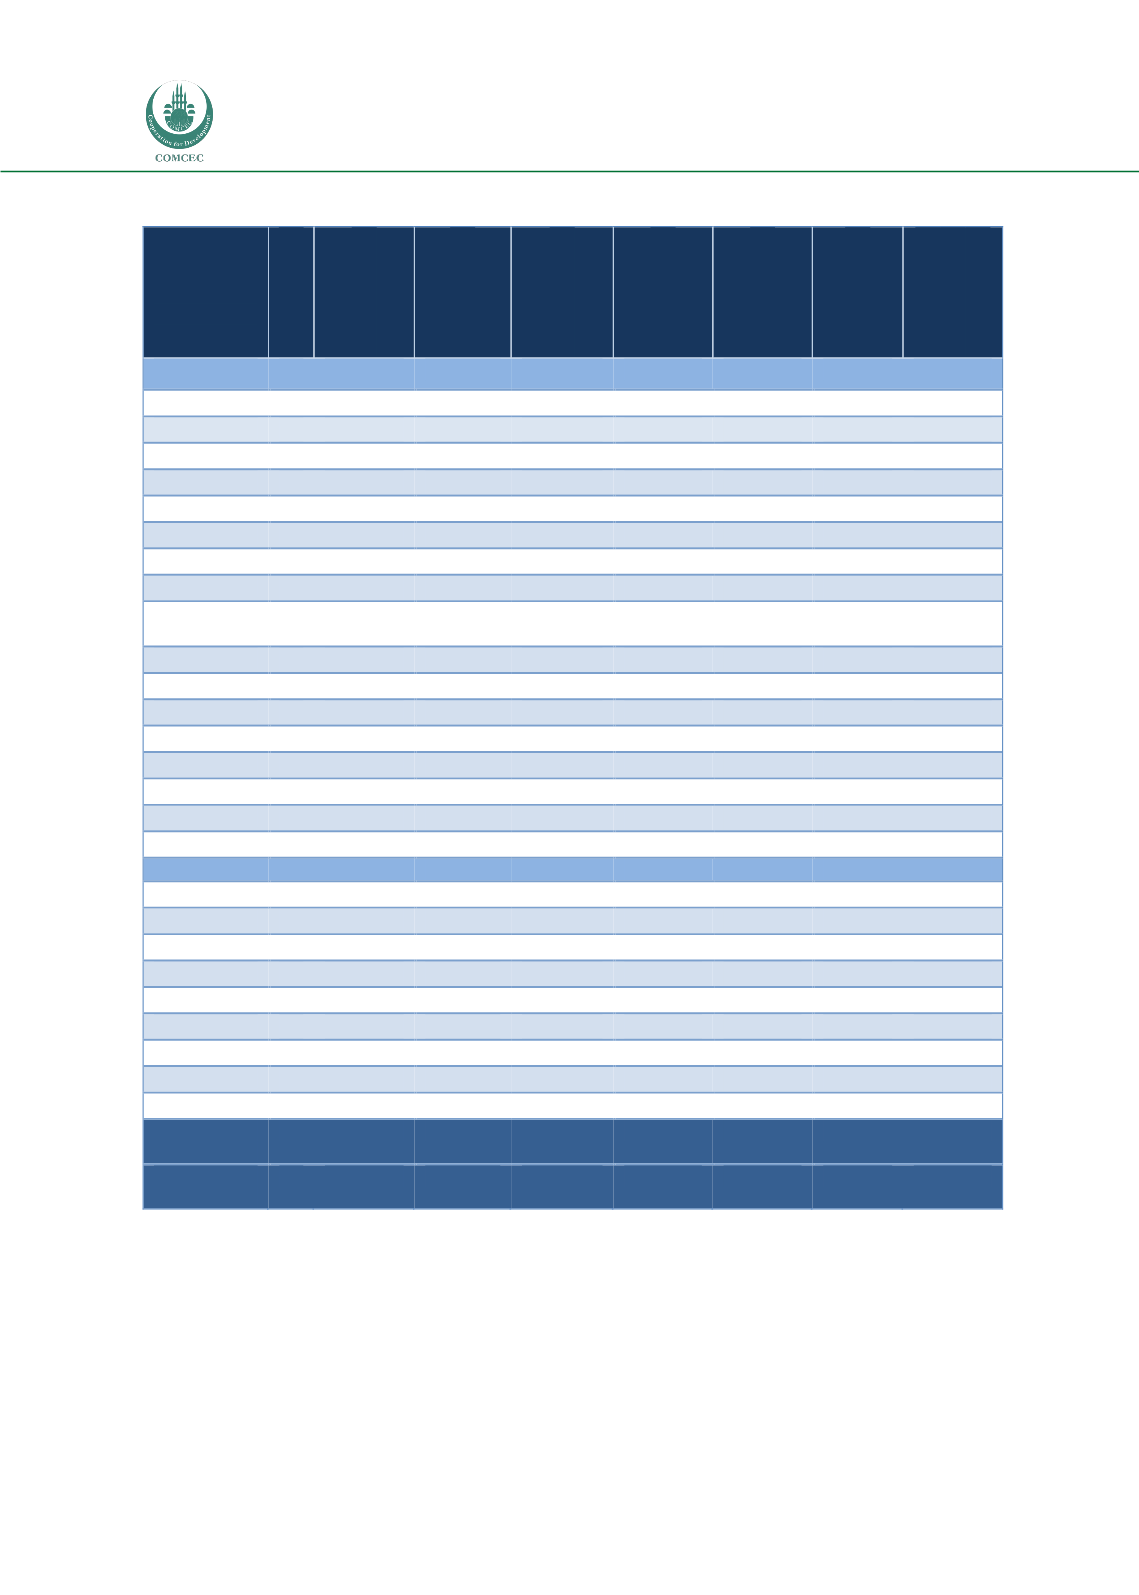
Table 8: Types of Response to FAO Questionnaires in Africa (2005-2011)
No. of Count.
Production
Trade
Prices
Land
Fertilizer
Pesticides
Machinery
African Group
17
6/71/23
12/35/53
24/71/5
53/41/6
35/47/18
53/47/0
41/59/0
Benin
I
F
N
N
N
N
N
Burkina Faso
I
I
I
I
I
I
I
Cameroon
I
F
I
I
I
I
I
Chad
I
I
N
I
N
N
N
Côte d'Ivoire
F
F
I
N
I
N
N
Gabon
N
I
N
N
I
N
N
Gambia
F
F
I
I
F
I
I
Guinea
I
I
I
N
I
I
N
Guinea-
Bissau
I
N
I
N
N
N
N
Mali
F
I
F
I
I
I
I
Mozambique
I
I
I
N
N
I
I
Niger
I
F
I
F
F
I
I
Nigeria
I
F
I
N
I
N
I
Senegal
F
F
I
I
F
N
I
Sierra Leone
I
N
N
N
N
N
N
Togo
I
F
I
I
I
I
I
Uganda
I
F
I
N
N
N
I
Arab Group
9
33/11/56
33/11/56
33/22/45
44/22/34
44/44/12
44/56/0
67/33/0
Algeria
F
F
I
I
I
I
I
Comoros
N
N
N
N
N
I
N
Djibouti
N
N
N
N
N
N
N
Egypt
F
F
F
F
F
N
I
Libya
N
N
N
N
N
N
N
Mauritania
I
F
F
N
N
I
N
Morocco
F
F
F
F
I
I
N
Sudan
F
I
I
F
I
N
N
Tunisia
F
F
F
I
I
I
I
COMCEC
Average
26
15/50/35
19/27/54
27/54/19
50/34/16
38/46/6
50/50/0
50/50/0
AFCAS
Average
52
15/56/29
19/23/48
35/48/17
50/40/10
40/48/12
58/42/0
54/44/2
Note1: N: Never reporting: Countries that have never reported data to FAO; I: Irregularly reporting: Countries
that reported to FAO no more than 4 out of 7 times in the 2005-2011 period; or no more than 2 out of 4 times
for pesticides and machinery; and F: Frequently reporting: Countries that reported to FAO regularly, for at
least 5 out of 7 years in the 2005-2011 period (at least 3 out of 4 years for machinery and pesticides).
Note2: In the averages a/b/c Numbers denote the percentages of N, I and F respectively.
Source: FAO, 2013a.