
Improving Agricultural Statistics in the COMCEC Region
19
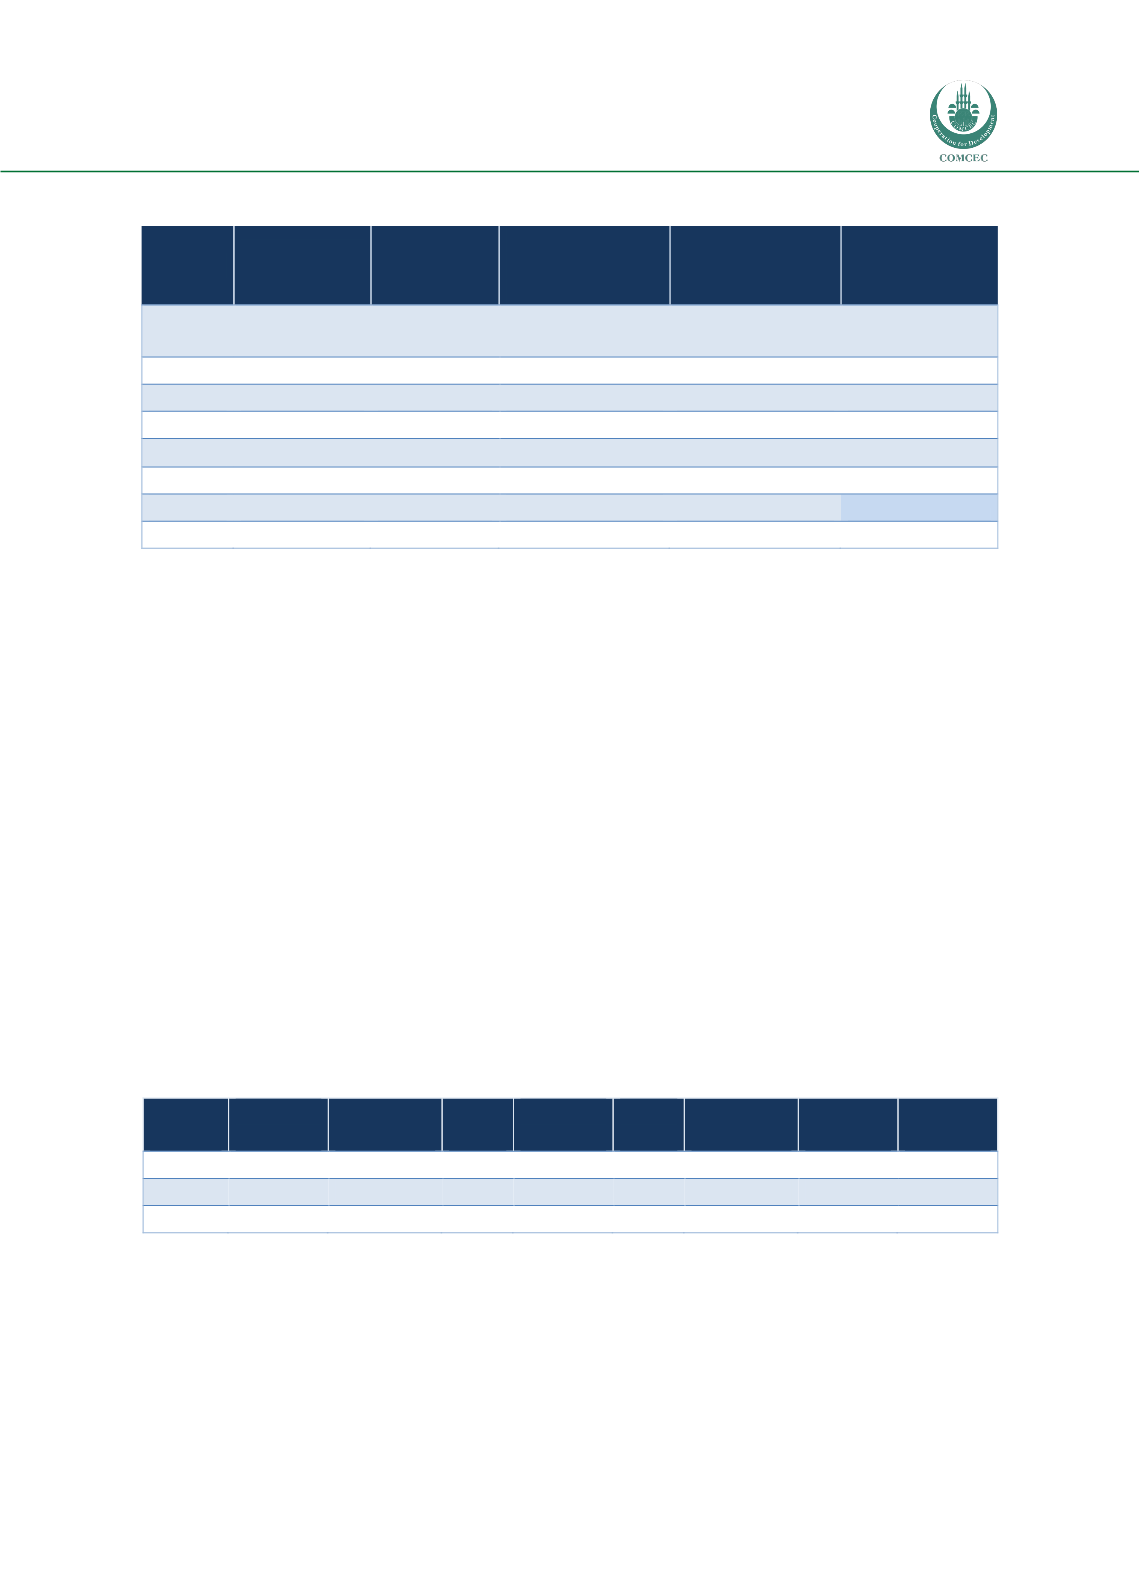
Table 4: Correspondence between COMCEC Members and FAO Regional Members
Region
Number of
UN Members
Number of
FAO
Members
Number of
COMCEC
Members
Number of
FAO
Members
Number of
COMCEC
Members
AFRICA
UN
RAF
COMCEC in RAF
AFCAS
COMCEC in AFCAS
58
48
24
52
26
ASIA
UN
RAP
COMCEC in RAP
APCAS
COMCEC in APCAS
75
70
27
25
6
AMERICA
COMCEC in America
2
EUROPE
COMCEC in Europe
1
Source: UNSD, 2014.
The response rates to FAO questionnaires in the world varied between 28 percent and
73 percent during the seven years between 2005 and 2011. The highest rate of response was
registered in agricultural trade statistics, which are compiled as part of overall trade statistics
jointly by FAO and UNSC. The lowest response rate was registered in machinery statistics. In
52 AFCAS Member Countries, the rates of response were significantly lower, ranging between
17 percent for machinery and 60 percent for agricultural trade. The 26 COMCEC Member
Countries, which are also AFCAS members, registered better rates of response for production
questionnaires where they performed even better than the global average. However, their
performance was substantially worse than the AFCAS and global responses for pesticide and
machinery questionnaires (Table 5).
The unsatisfactory response rates to FAO questionnaires were due to late and irregular
responses but also at times from receiving no responses at all. Between 2005 and 2011, on
average 36 percent of the COMCEC Member Countries never responded to 36 percent of FAO
questionnaires, as was the similar case for 38 percent of AFCAS members who never
responded either. Only 20 percent of COMCEC Members responded regularly to FAO
questionnaires and the remaining 44 percent responded irregularly.
Table 5: Response Ratios to FAO Questionnaires in Africa (2005-2011)
No. of
Count.
Production
Trade
Producer
Prices
Land
Use
Fertilizers
Pesticides
Machinery
COMCEC
26
0.50
0.57
0.34
0.22
0.26
0.08
0.06
AFCAS
52
0.40
0.60
0.30
0.20
0.24
0.19
0.17
WORLD
227
0.44
0.73
0.53
0.26
0.52
0.34
0.28
Source: Table 8 and FAO, 2013a.
No response rates are highest in resource statistics reaching 50 percent for land, pesticides
and machinery and lowest in production and trade statistics questionnaires. Only trade
questionnaires succeed in registering over 50 percent regular and frequent responses (Table
6). The distribution of frequent, irregular and no responses in AFCAS Members is about the


