


 90 / 272

Reviewing Agricultural Trade Policies
To Promote Intra-OIC Agricultural Trade
78
Asian group has the largest share in Turkey’s total imports of agricultural rawmaterials and the
share has increased from 11.9% in 2008 to 15%
in 2016. Figure 4.10 shows that the shares of
the Arab group and African group is small in total imports of Turkey’s agricultural rawmaterials.
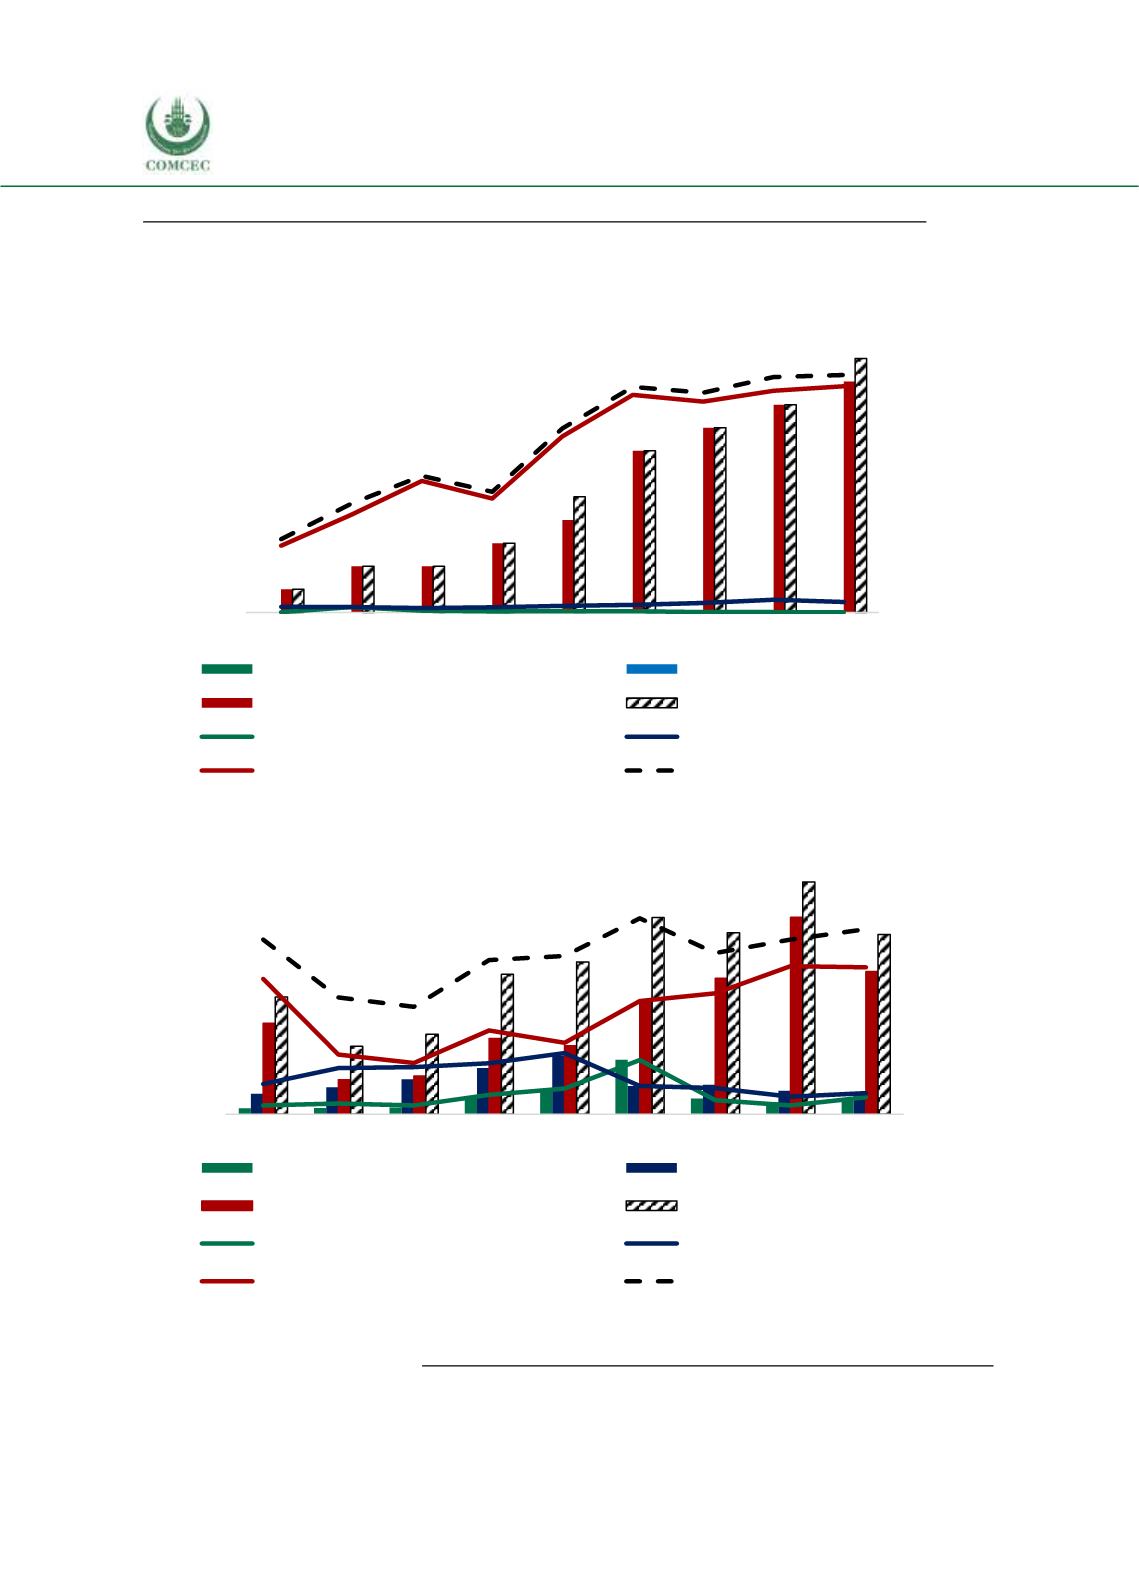
Figure 4. 11 Exports of Turkey’s Fish Products to the OIC Groups
Source: CEPII BACI, Eurostat RAMON, UN Comtrade, UN Trade Statistics, and authors’ calculations
Figure 4. 12 Imports of Turkey’s Fish Products from the OIC Groups
Source: CEPII BACI, Eurostat RAMON, UN Comtrade, UN Trade Statistics, and authors’ calculations
With regards to fish products, Arab group has the highest share in Turkey’s total fish exports,
followed by Asian group and African group. The share of Arab group in Turkey’s fish exports
0,00
0,02
0,04
0,06
0,08
0,10
0,12
0
2
4
6
8
10
12
14
2008 2009 2010 2011 2012 2013 2014 2015 2016
billion USD
%
African group (billion USD)
Asian group (billion USD)
Arab group (billion USD)
OIC total (billion USD)
African share in total fish exp. (%)
Asian share in total fish exp. (%)
Arab share in total fish exp. (%)
OIC share in total fish exp. (%)
0
8
16
24
32
40
0
4
8
12
16
20
2008 2009 2010 2011 2012 2013 2014 2015 2016
African Group (million USD)
Asian Group (million USD)
Arab Group (million USD)
OIC Total (million USD)
African share in total fish imp. (%)
Asian share in total fish imp. (%)
Arab share in total fish imp. (%)
OIC share in total fish imp.
(%)
million USD
%