


 92 / 272

Reviewing Agricultural Trade Policies
To Promote Intra-OIC Agricultural Trade
80
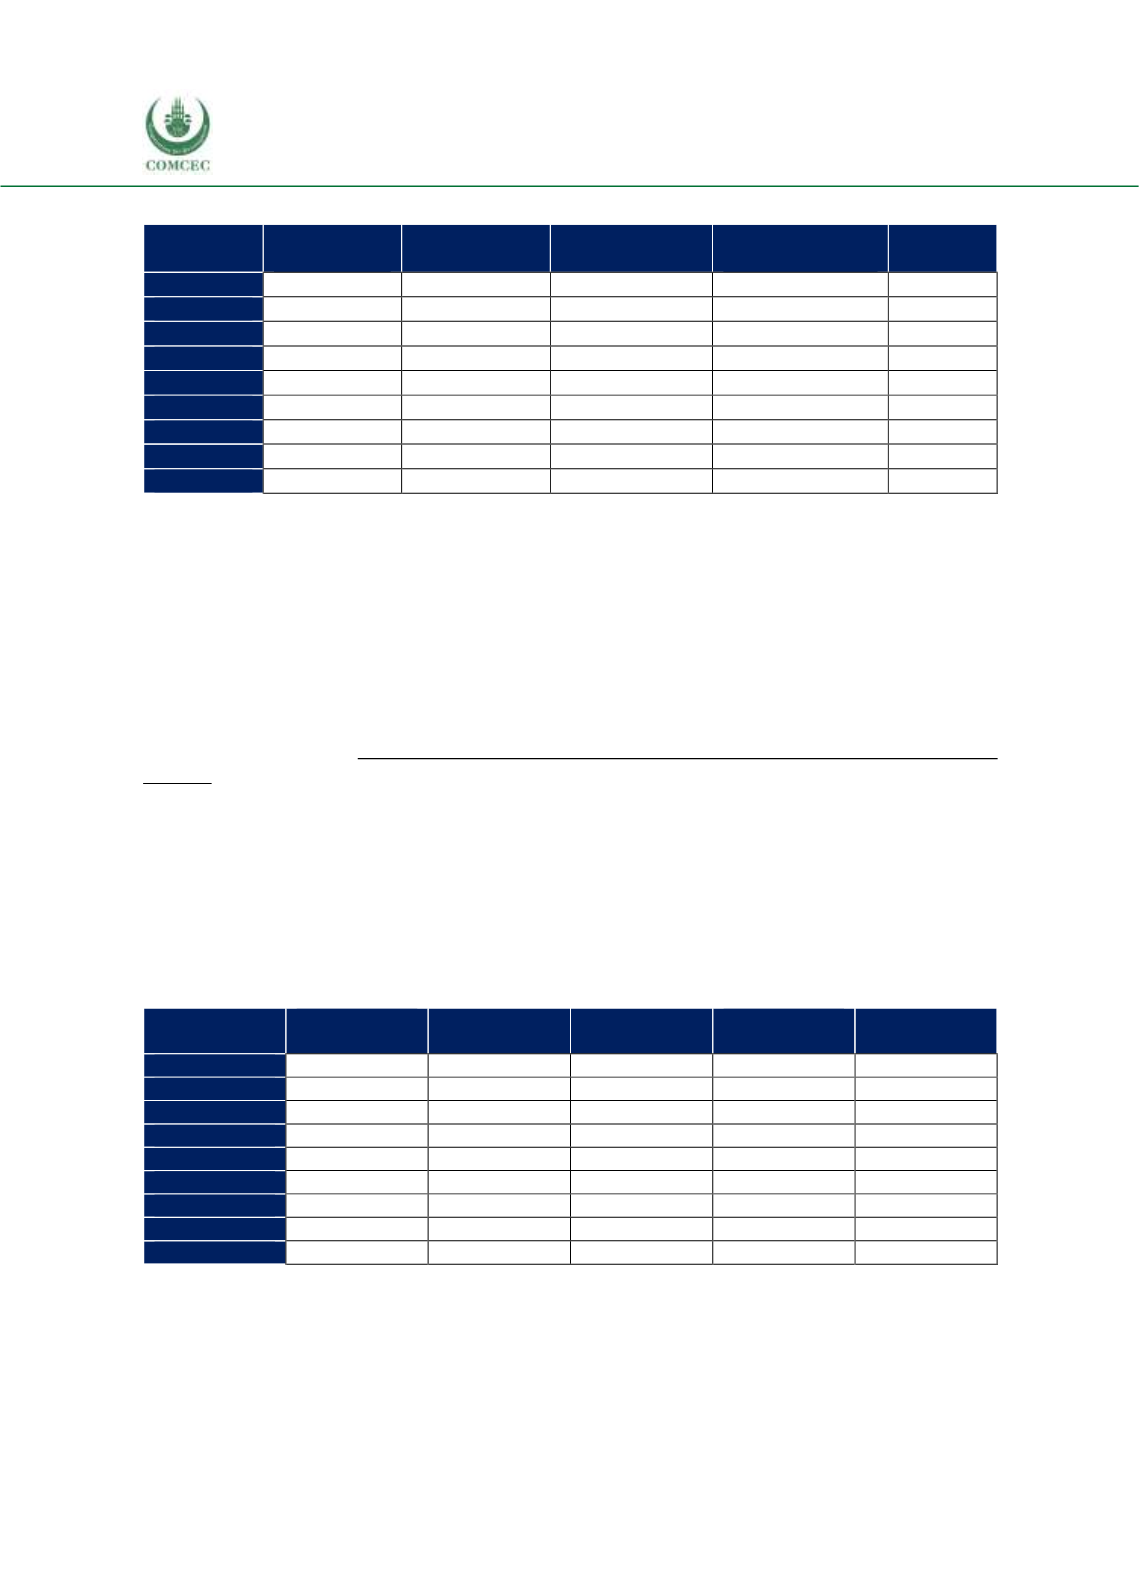
Table 4. 3 Distribution of Turkey’s Top 5 Export Products according to Destination, %
African
group
Asian group
Arab group
Non-OIC
Countries
Total
2008
1.1
4.7
22.8
71.3
100
2009
1.1
5.2
25.7
67.9
100
2010
1.1
5.2
26.3
67.4
100
2011
1.4
6.6
30.8
61.3
100
2012
1.4
4.7
34.5
59.4
100
2013
2.1
4.1
34.0
59.8
100
2014
1.7
4.2
33.4
60.7
100
2015
1.5
3.9
32.8
61.9
100
2016
1.5
4.3
36.5
57.7
100
Source: CEPII BACI, Eurostat RAMON, UN Comtrade, UN Trade Statistics, and authors’ calculations
The products in the two list are not mutually exclusive. “Animal and vegetable oils, fats and
waxes” and “vegetables and fruits” are products that are both commonly exported to and
imported from OIC countries. The reason may be that the combinations of the product groups
according to higher digits are different and that export products and import products at higher
digit SITC levels are different.
Table 4.3 shows the distribution of the top 5 agricultural export products to the OIC according
to destinations. The share of non-OIC countries in total OIC exports of top five agricultural export
products has declined from 71.3% to 57.7% over the period between 2008 and 2016. During
the observation period, the share of the Arab group increased from 22.8% to 36.5% in total OIC
exports at the expense of non-OIC countries, while the shares of African and Asian group did not
change much.
Table 4.4 shows the distribution of top 5 agricultural import products from the OIC countries
according to the region of origin. The share of non-OIC countries in Turkey’s top agricultural
import products increased from 76.5% to 84.2%during the 2008-2016 period. During the same
period, the share of the Asian group declined from 21.5% to 12.9 and the share of African and
Arab group did not change much. The share of the Asian group declined at the expense of non-
OIC countries.
Table 4. 4 Distribution of Turkey’s Top 5 Import Products, according to Origin, %
African
group
Asian group
Arab group
Non-OIC
Countries
Total
2008
0.1
21.5
1.9
76.5
100
2009
0.3
13.9
2.9
82.9
100
2010
0.4
16.2
2.9
80.5
100
2011
0.6
15.0
1.1
83.3
100
2012
0.5
16.4
1.4
81.7
100
2013
0.5
13.4
1.2
84.9
100
2014
0.5
11.5
1.2
86.8
100
2015
0.6
11.4
1.5
86.6
100
2016
1.1
12.9
1.8
84.2
100
Source: CEPII BACI, Eurostat RAMON, UN Comtrade, UN Trade Statistics, and authors’ calculations
Table 4.5 shows that Iraq is the largest importer of Turkey’s top five agricultural export products
in the OIC market. The share of Iraq in the last available three-year average is 43.7% while the
second largest market (Syria) has a share of 8.9%. The lower share is due to the ongoing
conditions in Syria. The third largest market is Saudi Arabia, followed by Iran and Sudan.