


 94 / 272

Reviewing Agricultural Trade Policies
To Promote Intra-OIC Agricultural Trade
82
agricultural support has declined from about 4.5% in the early 2000s to nearly 2.5%, it is still
sizably larger than the OECD and EU averages of about 0.6%. Besides, the share of price supports
within the total agricultural support is about 3-4 times larger than the EU average.
Tariffs
Tariffs in agriculture are typically larger than tariffs in non-agricultural sectors. According to the
most recent WTO Tariff Profile Summary for Turkey, the simple average MFN applied tariff for
agriculture (roughly equal to 40%) is about 8 times larger than the corresponding average for
non-agricultural products in 2017. The corresponding ratio for 2016 is around 10.
The frequency distribution of MFN applied tariffs show that a majority of tariff rates in 2017 are
larger than 15% where nearly half of all agricultural tariff lines have rates larger than 25%.
Looking at the product lines, applied MFN rates for animal and dairy products remain larger
than 100%. With the notable exception of cotton that has 0% MFN applied tariff rate, all
agricultural products have MFN rates remaining larger than 10%.
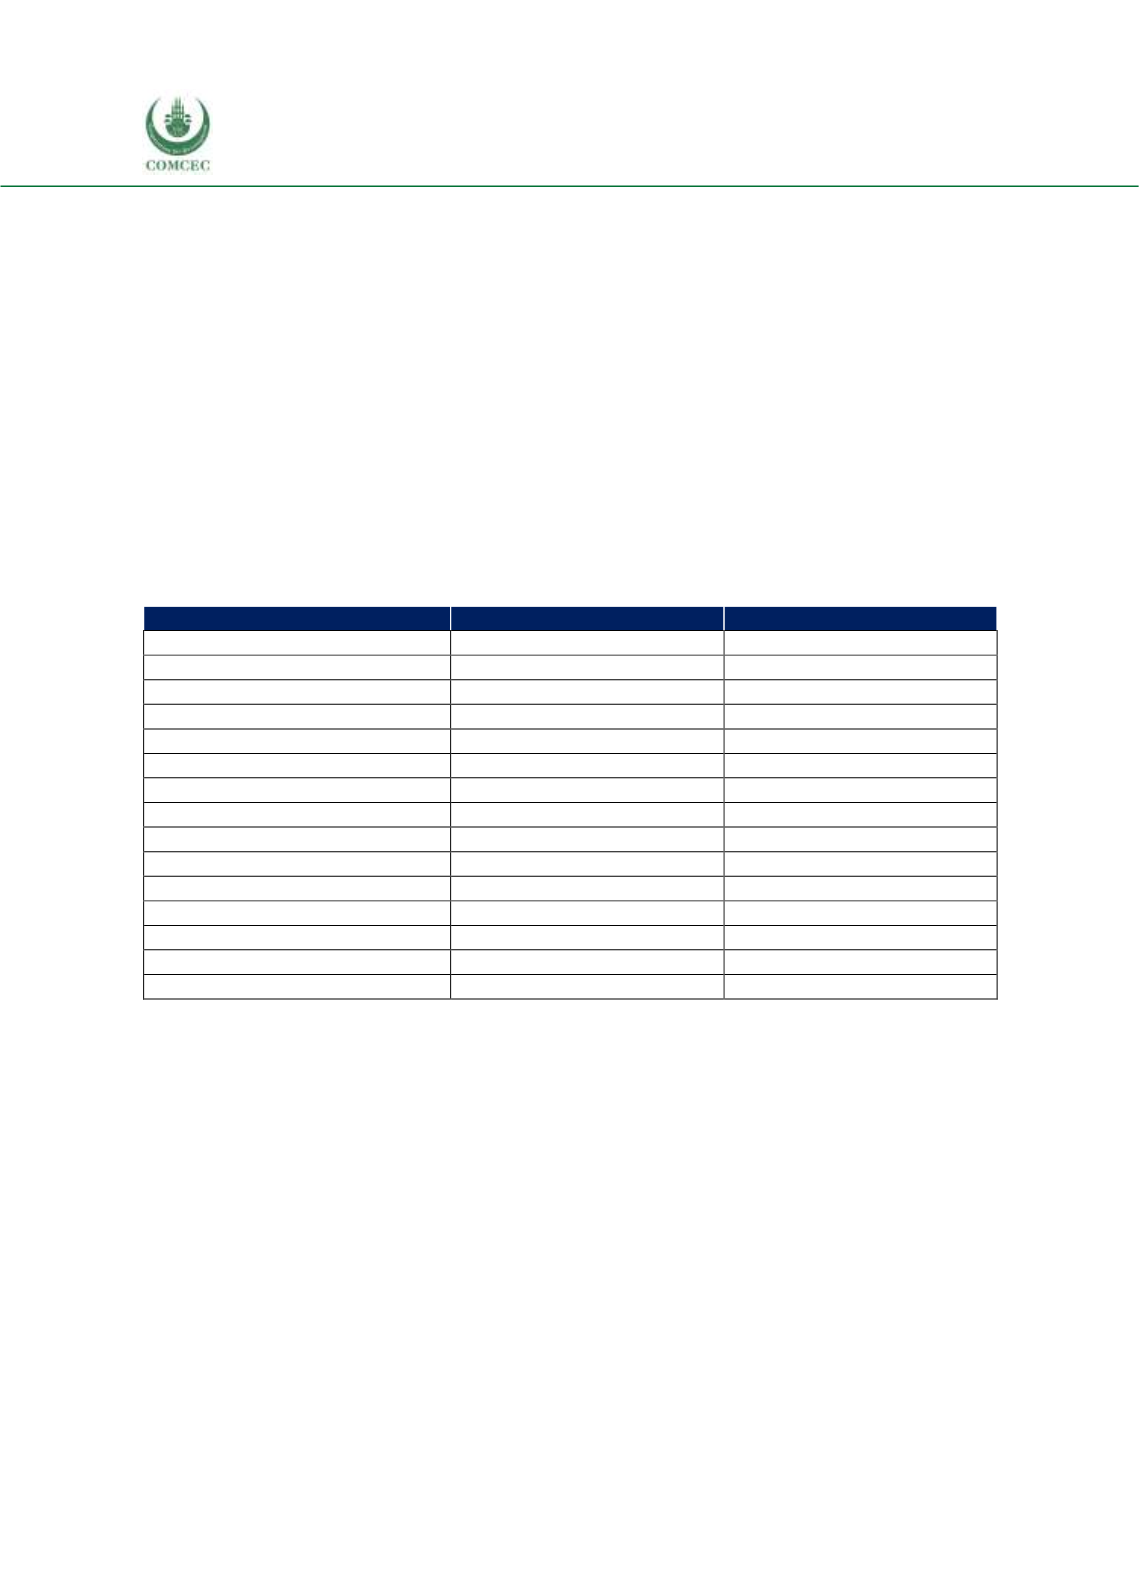
Table 4. 7 OIC Member Countries that Export to Turkey under Preferential Tariffs
African Group
Arab Group
Asian Group
Benin
Comoros
Afghanistan
Burkina Faso
Djibouti
Albania
Chad
Egypt
Bangladesh
Côte d'Ivoire*
Jordan
Indonesia*
Gambia
Mauritania
Iran
Guinea
Morocco
Kyrgyzstan
Guinea-Bissau
Somalia
Pakistan
Mali
Palestine
Tajikistan
Mozambique
Sudan
Uzbekistan
Niger
Tunisia
Malaysia
*
Nigeria*
Yemen
Senegal
Sierra Leone
Togo
Uganda
Source: WTO RTA Database.
Note: Countries marked with an asterisk are among the top 5 OIC countries from which Turkey’s top
import products are imported. Countries written in boldface letters have a free trade agreement in force
with Turkey.
A quick comparison with the EU reveals that Turkey’s applied average MFN tariffs are larger
than the EU levels in animal products, dairy products, fruits and vegetables, and coffee and tea.
On the other hand, in beverages and tobacco, fish and fish products, cereals and preparations,
sugars and confectionery and in other agricultural products, average applied MFN rates are
nearly identical for EU and Turkey.
Turkey’s overall applied tariff average increased due to requests by domestic producers. There
is a possibility that the tariff rates will increase further. Tariff schedules are bound 100% of
agricultural tariff lines and 34% of industrial tariff lines. There are significant differences in the
rates of agricultural versus industrial products and average rates for agriculture are 49% and
only 5.5% for industrial products. Tariff protection is particularly high, averaging over 80%, on
meat, dairy, sugar and confectionary.