


 89 / 272

Reviewing Agricultural Trade Policies
To Promote Intra-OIC Agricultural Trade
77
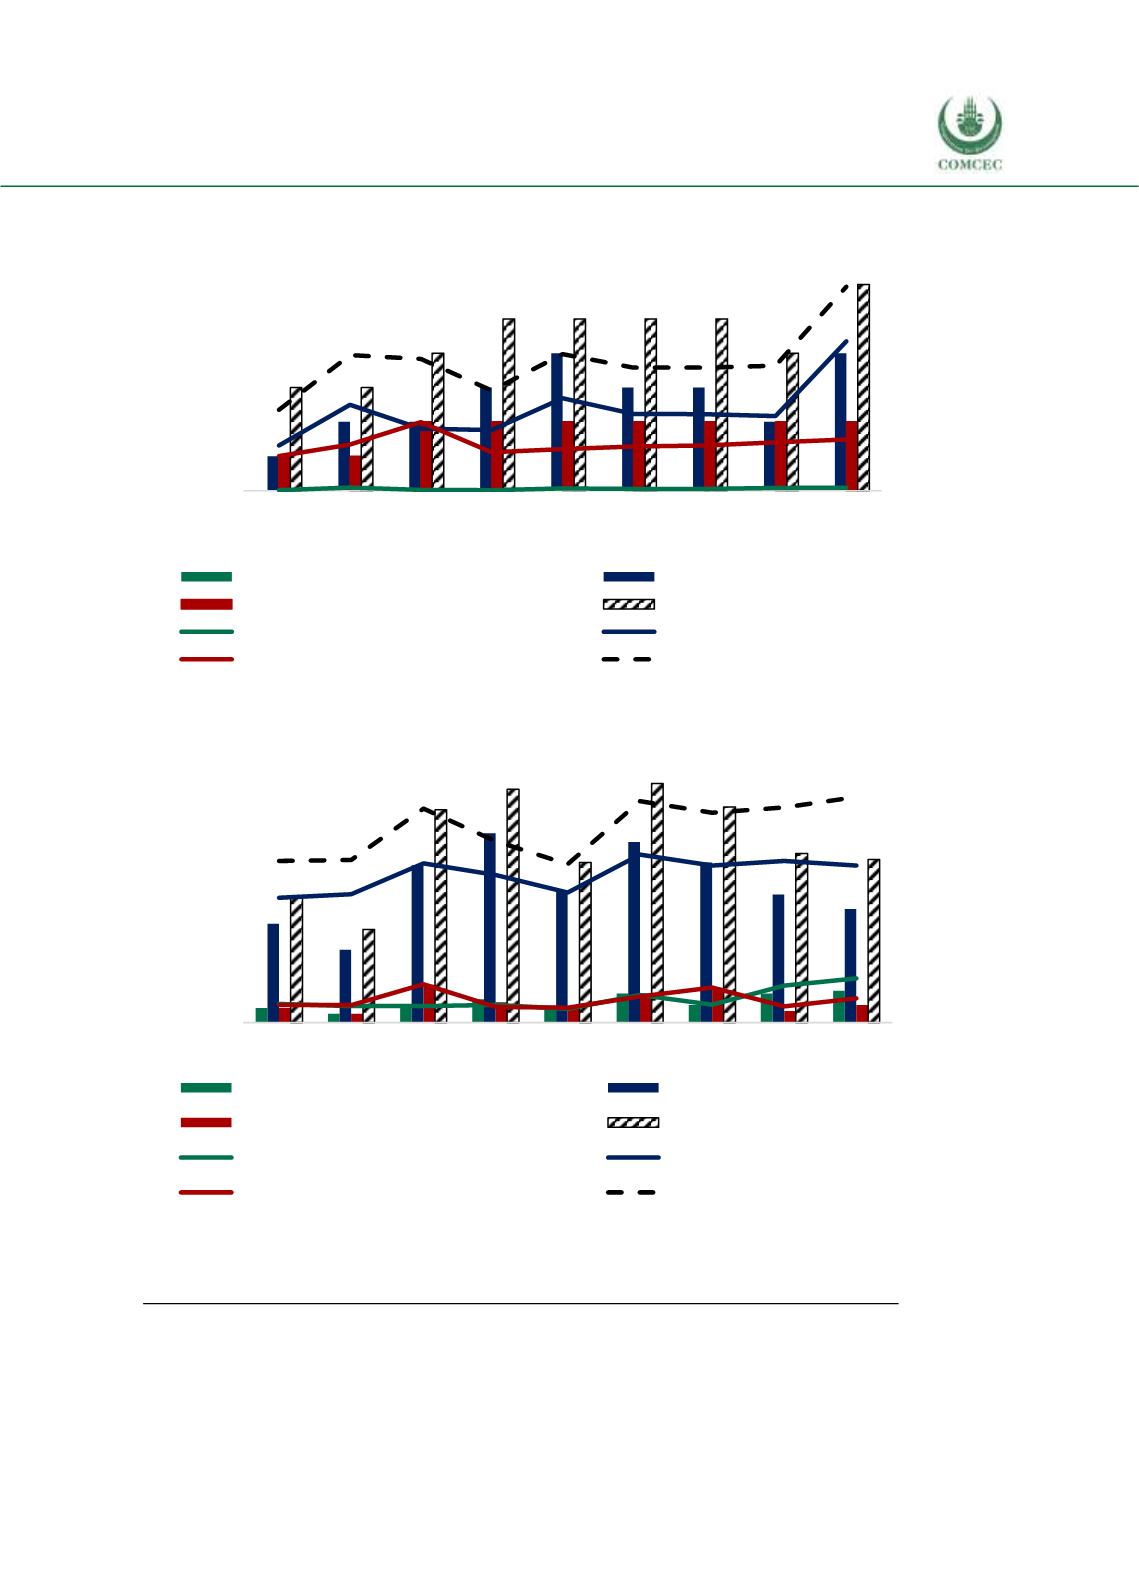
Figure 4. 9 Exports of Turkey’s Agricultural Raw Materials to the OIC Groups
Source: CEPII BACI, Eurostat RAMON, UN Comtrade, UN Trade Statistics, and authors’ calculations
Figure 4. 10 Imports of Turkey’s Agricultural Raw Materials from the OIC Groups
Source: CEPII BACI, Eurostat RAMON, UN Comtrade, UN Trade Statistics, and authors’ calculations
The share of African group in Turkey’s total exports in agricultural raw materials is very small.
The share of Asian group in Turkey’s agricultural rawmaterial exports is the highest among the
three country groups with an increase from 4.7% to 15.5%
during the 2008-2016 period. The
share of Arab group in Turkey’s agricultural rawmaterials is smaller than that of the Asian group
with a slight increase from 3.6% to 5.3%
percent in Turkey’s total agricultural raw material
exports (see Figure 4.9).
0,00
0,01
0,02
0,03
0,04
0,05
0,06
0,07
0
5
10
15
20
25
2008 2009 2010 2011 2012 2013 2014 2015 2016
billion USD
%
African group (billion USD)
Asian group (billion USD)
Arab group (billion USD)
OIC total (billion USD)
African share in total agri-raw exp. (%)
Asian share in total agri-raw exp. (%)
Arab share in total agri-raw exp. (%)
OIC share in total agri-raw exp. (%)
0,0
0,1
0,2
0,3
0,4
0,5
0,6
0,7
0,8
0,9
0
5
10
15
20
25
2008 2009 2010 2011 2012 2013 2014 2015 2016
billion USD
%
African group (billion USD)
Asian group (billion USD)
Arab group (billion USD)
OIC total (billion USD)
African share in total agri-raw imp. (%)
Asian share in total agri-raw imp. (%)
Arab share in total agri-raw imp. (%)
OIC share in total agri-raw imp. (%)