


 96 / 272

Reviewing Agricultural Trade Policies
To Promote Intra-OIC Agricultural Trade
84
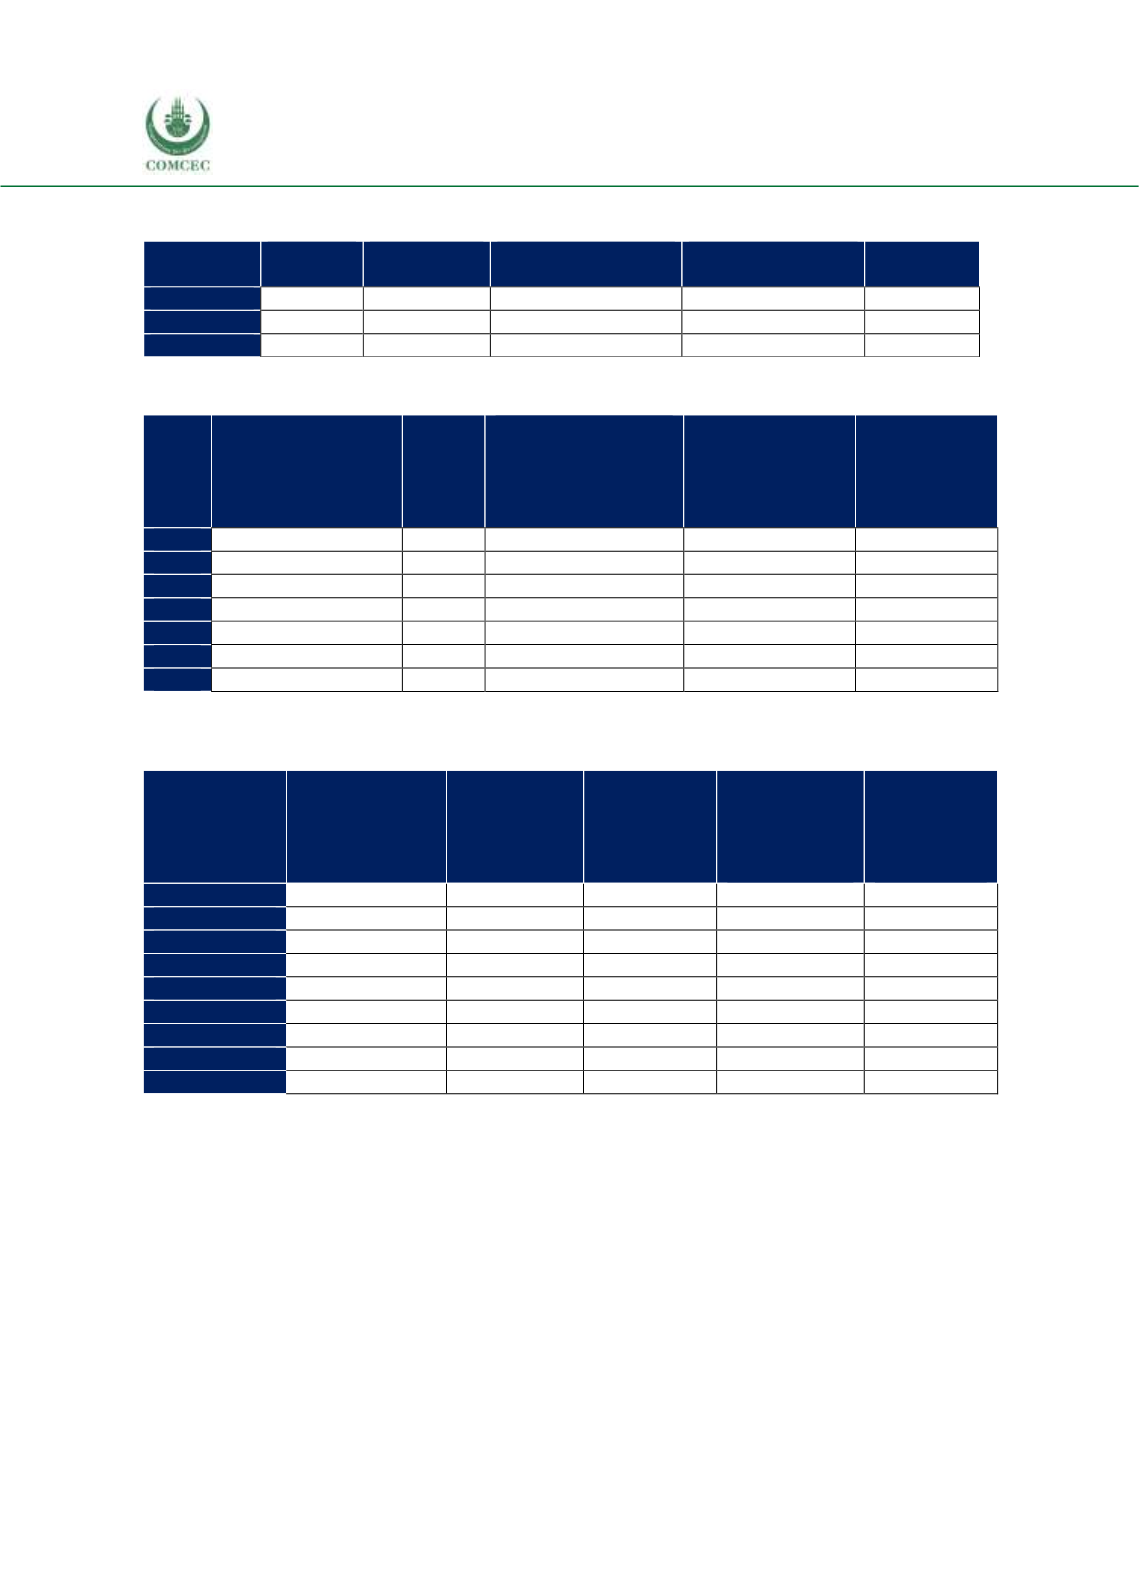
Table 4. 10 The Numbers Of NTMs Imposed by Turkey, In Force
Source: WTO I-TIP, CEPII BACI, Eurostat RAMON, UN Comtrade, UN Trade Statistics
Table 4. 11 NTMs of Turkey’s Top 5 Import Products from Top 5 OIC Exporters
41-42-43:
Animal and
vegetable oils, fats
and waxes
263:
Cotton
07:
Coffee, tea, cocoa,
spices, and
manufactures
thereof
22:
Oil-seeds and
oleaginous fruits
05:
Vegetables
and fruit
2010
1
2011
2
1
2012
2
1
1
1
2013
1
1
1
1
2014
3
3
1
2015
1
1
1
2016
3
1
1
Source: WTO I-TIP, CEPII BACI, Eurostat RAMON, UN Comtrade, UN Trade Statistics, and authors’
calculations
Table 4. 12 NTMs Applied to Turkey’s Top 5 Export Products by Top 5 OIC Importers
04:
Cereals and
cereal
preparations
05:
Vegetables
and fruit
11-12:
Beverages
and tobacco
41-42-43:
Animal and
vegetable oils,
fats and
waxes
02:
Dairy
products
and birds’
eggs
2008
1
1
1
1
1
2009
1
2
1
1
1
2010
2
3
2
2
2
2011
2
2
2
2
2
2012
2
3
1
1
2
2013
2
2
2
7
2
2014
2
2
1
2
2
2015
2
2
2
1
5
2016
3
3
2
2
3
Source: WTO I-TIP, CEPII BACI, Eurostat RAMON, UN Comtrade, UN Trade Statistics, and authors’
calculations
The NTM summaries of Turkey indicate that, in 2016, vegetable and animal product groups have
over 95% and 92% NTM coverage ratios, respectively. These correspond to NTM affected
product counts of 309 and 186 products, respectively.
Tables 4.11 and 4.12 collect the numbers of NTMs of Turkey’s top 5 import products from OIC
and top 5 export products to OIC as identified above. The overall stance of Turkey’s NTM
practices for its top 5 imports from the OIC does not exhibit major changes from 2010 to 2016.
Tables 4.13 and 4.14 collect more specific information about the number of different types of
NTMs imposed by Turkey on agricultural products and by how much trade is affected from the
imposition of these NTMs. Nearly 60% of animal products are subject to NTMs and this ratio is
around 88% in vegetables and close to 100% in hides and skins.
Export
Subsidies
Quantitative
Restrictions
Sanitary & Phyto-
sanitary Measures
Technical Barriers
to Trade
Total
Agri-Food
39
4
28
4
75
Fish
1
1
1
3
Agri-Raw
3
3