


 87 / 272

Reviewing Agricultural Trade Policies
To Promote Intra-OIC Agricultural Trade
75
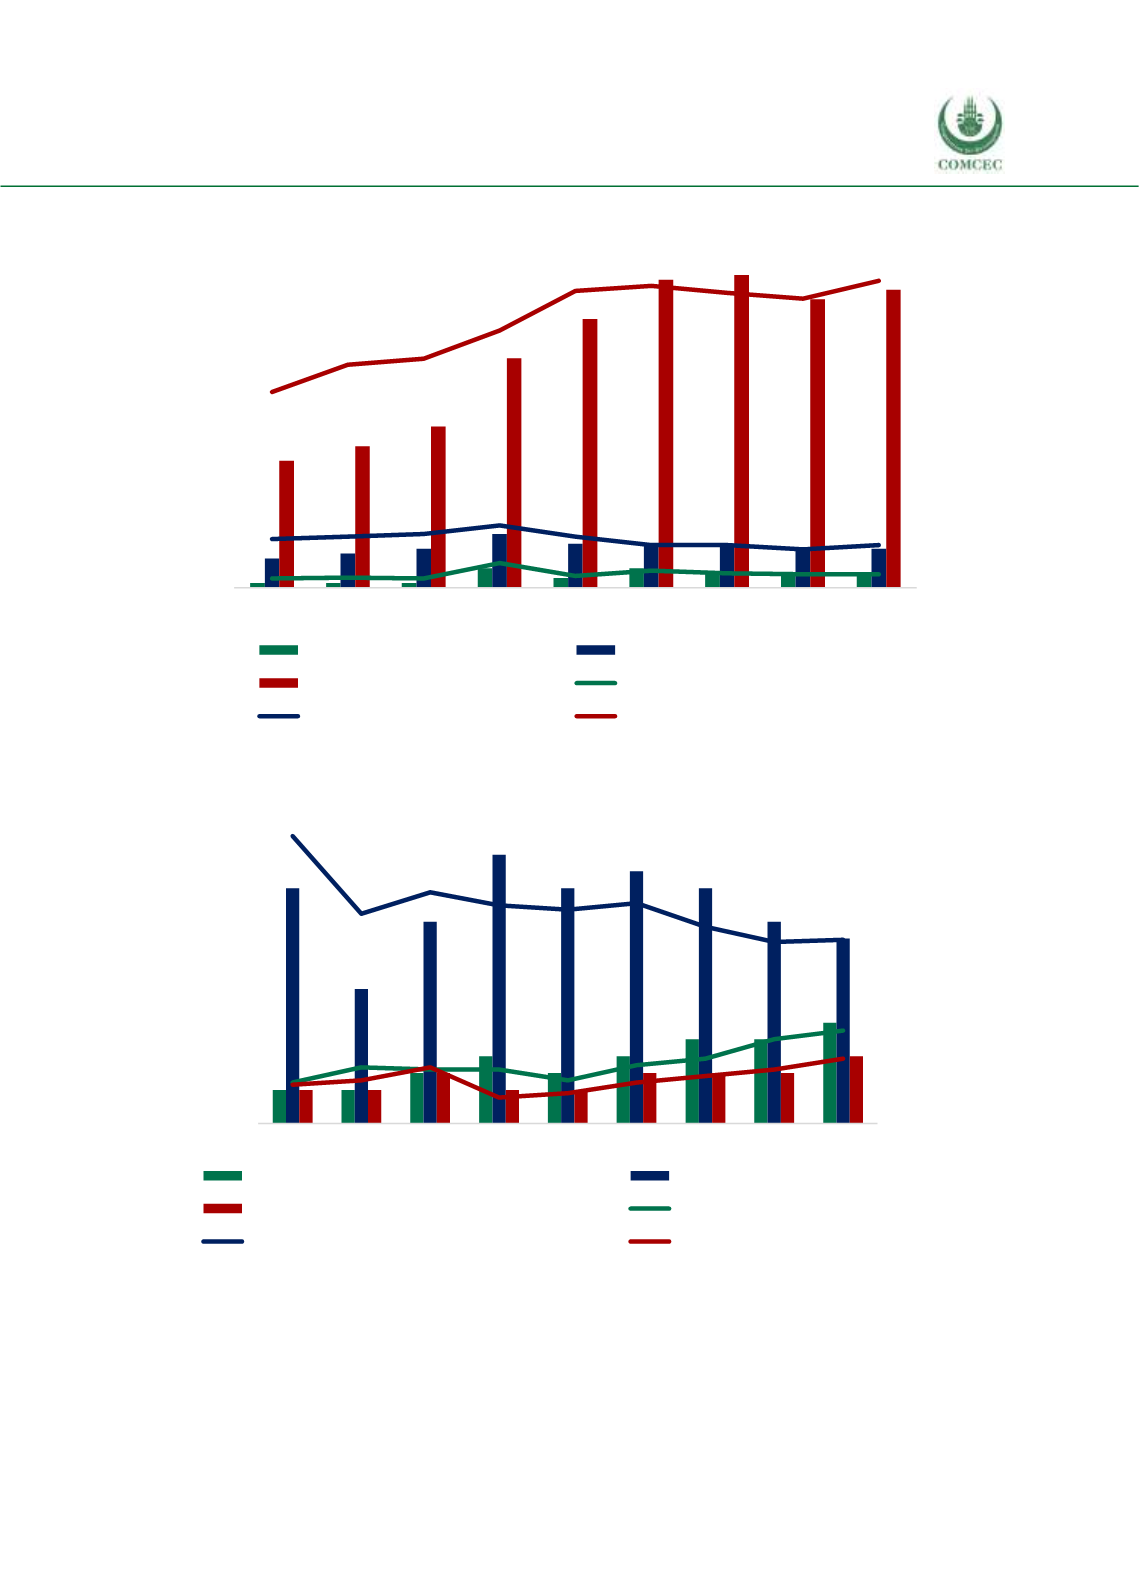
Figure 4. 5 Shares of OIC Groups in Turkey’s Agricultural Exports
Source: CEPII BACI, Eurostat RAMON, UN Comtrade, UN Trade Statistics, and authors’ calculations
Figure 4. 6 Shares of OIC Groups in Turkey’s Agricultural Imports
Source: CEPII BACI, Eurostat RAMON, UN Comtrade, UN Trade Statistics, and authors’ calculations
0
1
2
3
4
5
6
7
0
5
10
15
20
25
30
35
40
2008 2009 2010 2011 2012 2013 2014 2015 2016
billion USD
%
African Group (billion USD)
Asian Group (billion USD)
Arab Group (billion USD)
African Share in total Agr. Exp. (%)
Asian Share in total Agr. Exp. (%)
Arab Share in total Agr. Exp. (%)
0,0
0,2
0,4
0,6
0,8
1,0
1,2
1,4
1,6
1,8
0
2
4
6
8
10
12
14
2008 2009 2010 2011 2012 2013 2014 2015 2016
billion USD
%
African Group (billion USD)
Asian Group (billion USD)
Arab Group (billion USD)
African Share in total Agr. Imp. (%)
Asian Share in total Agr. Imp. (%)
Arab Share in total Agr. Imp. (%)