
Reviewing Agricultural Trade Policies
To Promote Intra-OIC Agricultural Trade
35
maximum level of 1,614 billion USD in 2014. After 2014, there has been a slight decline in both
the world and non-OIC volumes of agricultural trade.
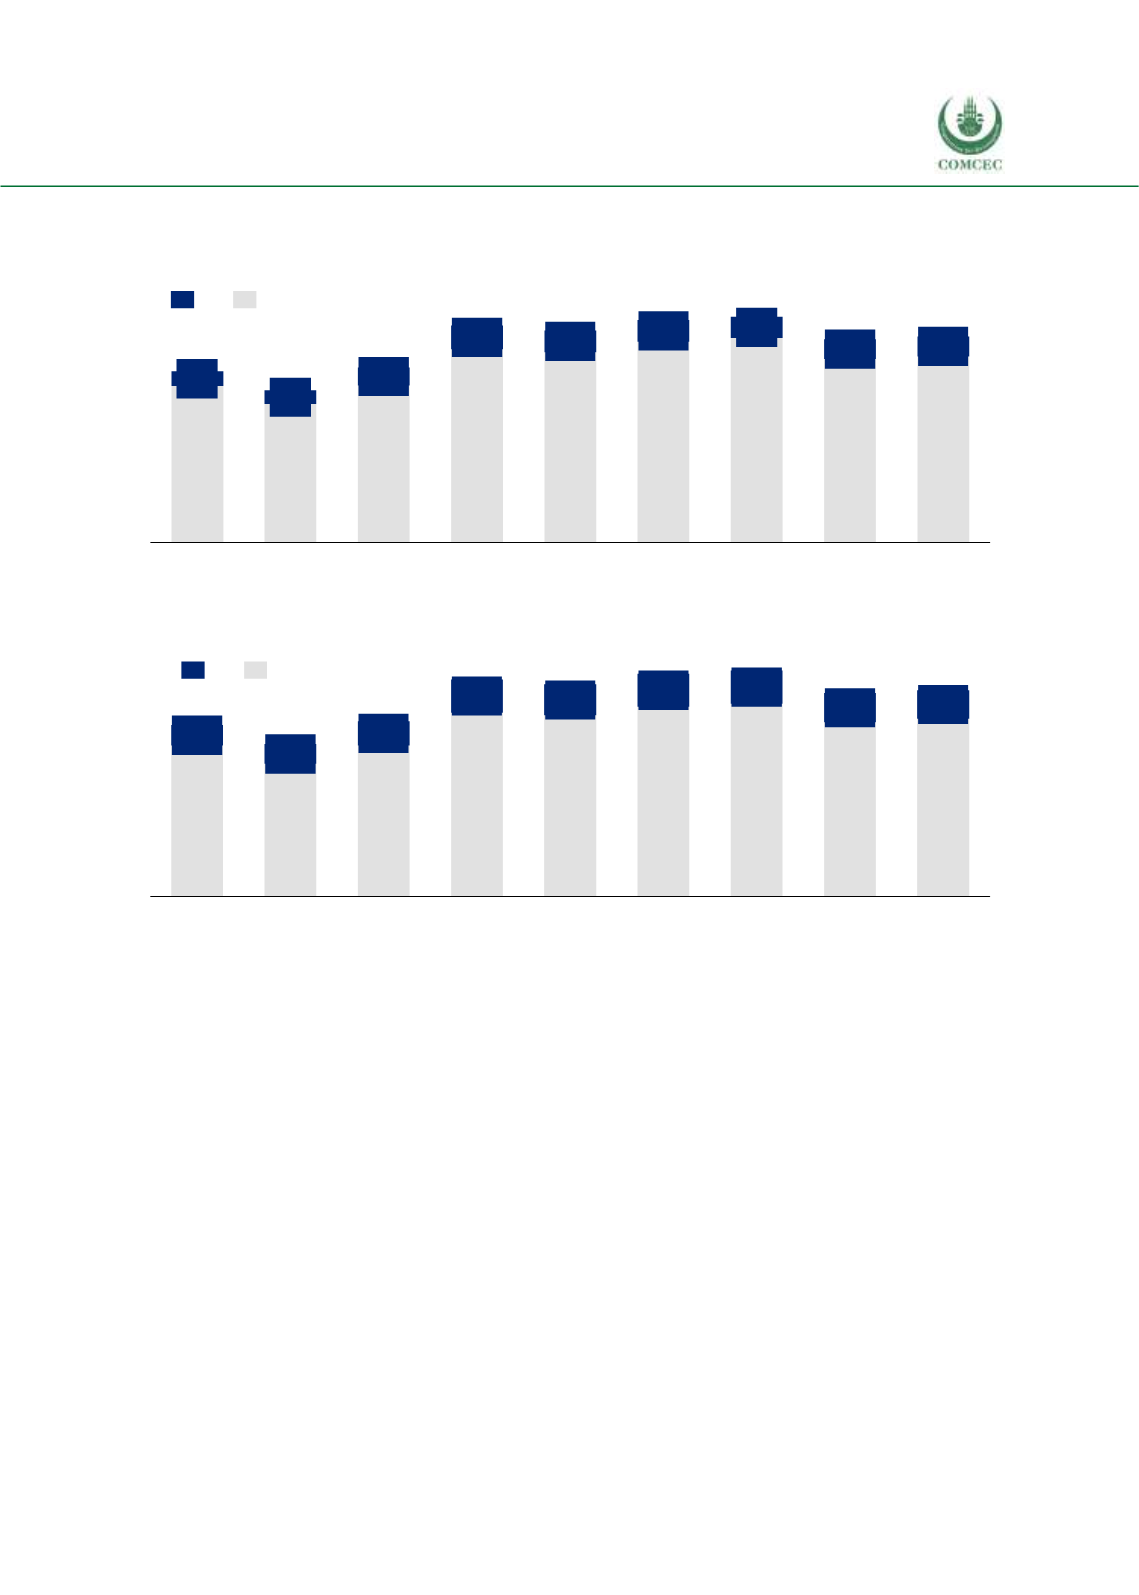
Figure 3. 2 Agricultural Exports: Non-OIC versus the OIC, Billion USD (%), 2008-2016
Source: ITC Macmap, CEPII BACI, Eurostat RAMON, UN Comtrade, UN Trade Statistics, and authors’
calculations
Figure 3. 3 Agricultural Imports: Non-OIC versus the OIC, Billion USD (%), 2008-2016
Source: ITC Macmap, CEPII BACI, Eurostat RAMON, UN Comtrade, UN Trade Statistics, and authors’
calculations
The share of OIC countries in world total agricultural exports did not change markedly over the
last decade, fluctuating within the range of 8.5 to 10.9%, with an approximate average share of
9.8% (see Table F.1 in Annex F). The share of the OIC group imports in global agricultural trade
is between 11.9% and 15.3%, hitting its maximum in 2011, and decreasing thereafter (see Table
F.2 in Annex F). The average share of the OIC imports in global agricultural trade has been 14%
during the 2008-2016 period. As such, the OIC area as a whole is a net importer, with a larger
global share of imports than exports.
The Asian group is undoubtedly the largest exporter of all product groups in 2016 as seen in
Figure 3.4. The low export shares of the Arab group and the African group reflect low production
potential both with regards to geographical and climatic conditions as well as agricultural
production and trade policies of the African and Arab countries. The Arab countries are
characterized by high population growth rates and large and rapidly increasing food deficits
caused by limited resources resulting with low potential for exports and need for imported
goods (McDonnel and Abdel-Dayam, 2012).
1,120
989
1,123
1,382
1,359
1,435
1,462
1,312
1,330
2012
2008
2009
2015
141
(10%)
2010
2011
2014
2013
2016
104
(8%)
99
(9%)
129
(10%)
168
(11%)
156
(10%)
156
(10%)
152
(9%)
144
(10%)
Non-OIC
OIC
1,078
948
1,079
1,312
1,294
1,356
1,379
1,244
1,270
222
(15%)
2008
238
(15%)
2009
141
(13%)
235
(15%)
145
(12%)
173
(14%)
2010
2011
2012
2013
235
(15%)
2014
209
(14%)
2015
204
(14%)
2016
OIC Non-OIC


