


 46 / 272

Reviewing Agricultural Trade Policies
To Promote Intra-OIC Agricultural Trade
34
Chapter 3: Analysis of Agricultural Trade Policies of OIC Member
Countries
The agricultural trade policies of the OIC member countries are analyzed in this chapter. The
chapter is organized as follows: A general overview of agricultural commodity flows at the
product section level/product division level and the three official OIC country groups is
presented in Section 3.1. Agricultural trade policy objectives pursued by the OIC countries are
discussed in Section 3.2. An overview of the measures that are commonly used by the OIC
countries to achieve cross-border and domestic policy targets, including measures that affect
imports, exports or domestic production, is presented in Section 3.3. Bilateral trade flows across
the OIC country groups/countries at the product division/product level are analyzed in Section
3.4. The aim is to identify key agricultural products whose cross-border flows between the OIC
members and third parties could potentially be diverted to boost intra-OIC trade. The main
results of the online survey that has been designed to poll various stakeholders in the OIC
countries are summarized in Section 3.5. Conclusions and lessons learned from this chapter are
collected in Section 3.6.
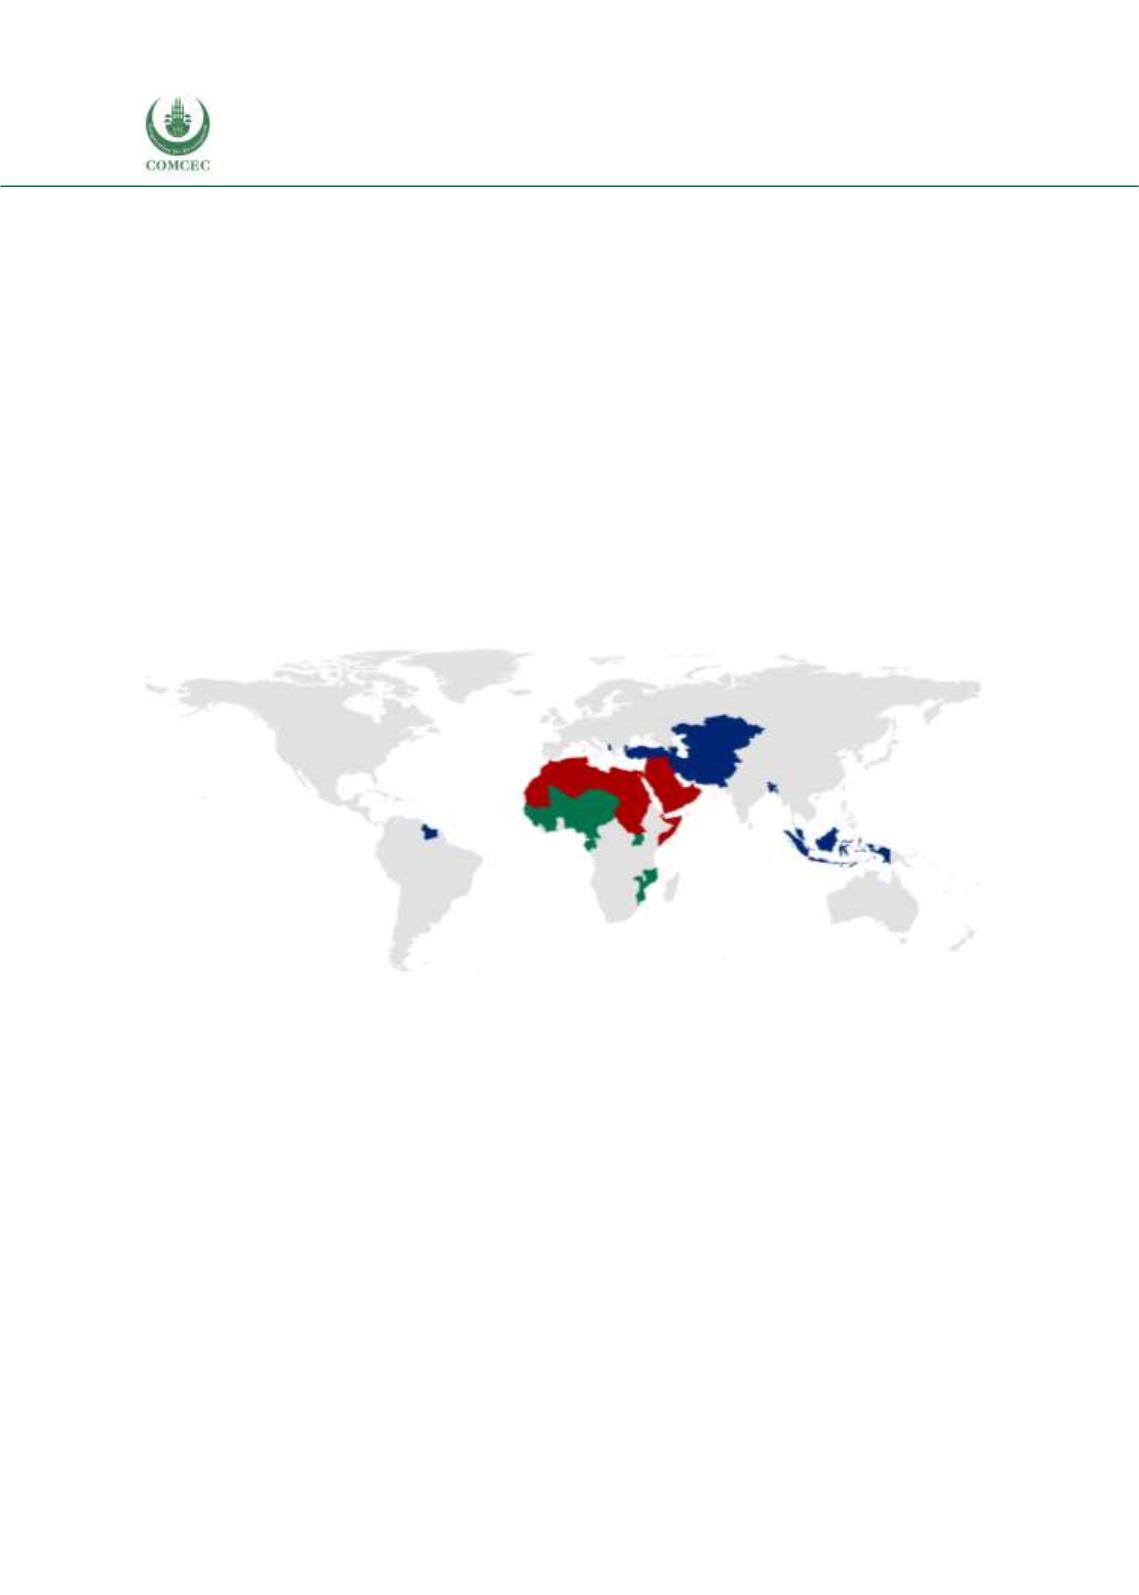
Figure 3. 1 Map of OIC Countries
Source: Authors’ visualizations
Note: Blue, red, and green shaded areas denote Asian group, Arab Group, and African Group OIC member
countries, respectively.
3.1. Composition and Patterns of Agricultural Trade in OIC Member
Countries
3.1.1. Overview of the agricultural trade patterns
As seen in Figure 3.1, the distribution of the 57 OIC countries covers a wide geographical area
contained by a range of countries with diverse economies. Despite its far-reaching distribution
across the world, the share of the OIC countries in global agricultural exports and imports has
been within the range of 8.5%-11.0% and 12%-15%, respectively during the last decade.
The paths of agricultural product exports and imports of the OIC in the past decade, relative to
the global volume of agricultural trade, are shown in Figures 3.2 and 3.3, respectively. Global
trade in agricultural products had moderate ups and downs during the decade, reaching its
African
Group
Arab
Group
Asian
Group