


 53 / 272

Reviewing Agricultural Trade Policies
To Promote Intra-OIC Agricultural Trade
41
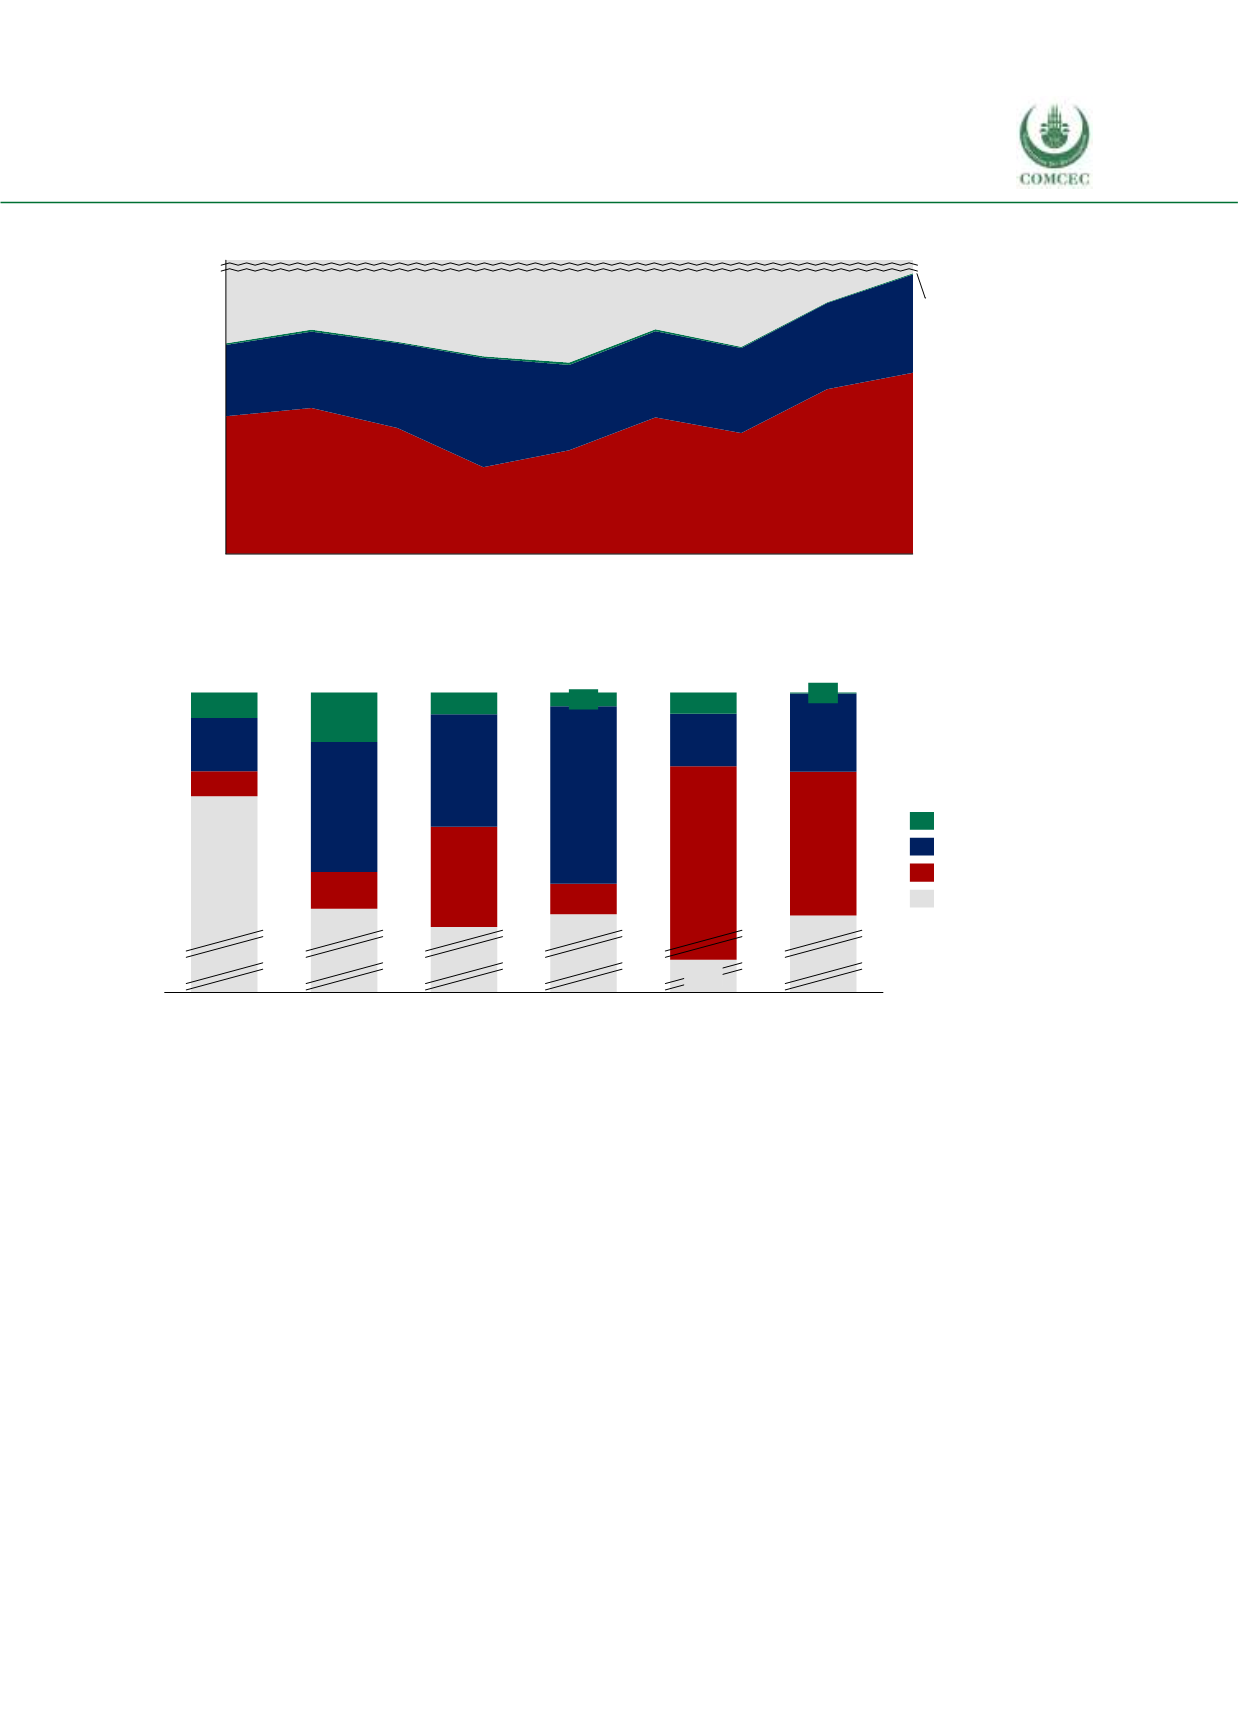
Figure 3. 11 Origin of Top 5 Import Products of Arab Group
Source: ITC Macmap, CEPII BACI, Eurostat RAMON, UN Comtrade, UN Trade Statistics, and authors’
calculations. Note: Top 5 products are identified considering 3 year average between 2014 and 2016.
Figure 3. 12 Breakdown of Agricultural Trade by Partner, 2016
Source: ITC Macmap, CEPII BACI, Eurostat RAMON, UN Comtrade, UN Trade Statistics, and authors’
calculations
The overall situation in the year 2016 is pictured in Figure 3.12. Around ¾ of the imports of all
three country groups originate from the non-OIC countries, and non-OIC countries’ share as an
export destination is highest for the African group, followed by the Asian and the Arab groups.
The second largest group of origin for Africa and Asia is the Asian group. The second most
important region of origin for the Arab group is yet again the Arab group itself, indicating
relatively strong intra-group trade relationships within the region. Within the OIC group, the
export destination of the African and Asian groups is largely the Asian group while the export
destination of the Arab group is mostly the Arab group. Still, the Arab group’s trade ties with the
countries in the same group are strongest among all three OIC country groups.
3.2 Agricultural Trade Policy Objectives of OIC Member Countries
Agriculture has been prioritized by the COMCEC Economic Summit of November 2009, and,
together with trade, it has also been determined as one of the six cooperation areas of by the
COMCEC Strategy, adopted by the 4th Extraordinary Islamic Summit (14-15 Aug. 2012). The
strategic objective set for agriculture is “Increasing the productivity of agricultural sector and
sustaining food security in the OIC Member Countries.” The agricultural trade policy objectives
100%
10%
0%
5%
15%
20%
25%
2009
2016
2008
2010 2011 2012 2013 2014 2015
Non-OIC countries
Arab group
African group
Asian group
3%
4%
47%
3%
Exports of
Arab Group
44%
21%
Imports of
Asian Group
88%
2%
Imports of
African Group
9%
Exports of
Asian Group
6%
4%
Exports of
African Group
72%
12%
74%
6%
3%
74%
17%
75%
2%
15%
0%
13%
6%
Imports of
Arab Group
African Group
Asian Group
Arab Group
Non-OIC countries