


 44 / 272

Reviewing Agricultural Trade Policies
To Promote Intra-OIC Agricultural Trade
32
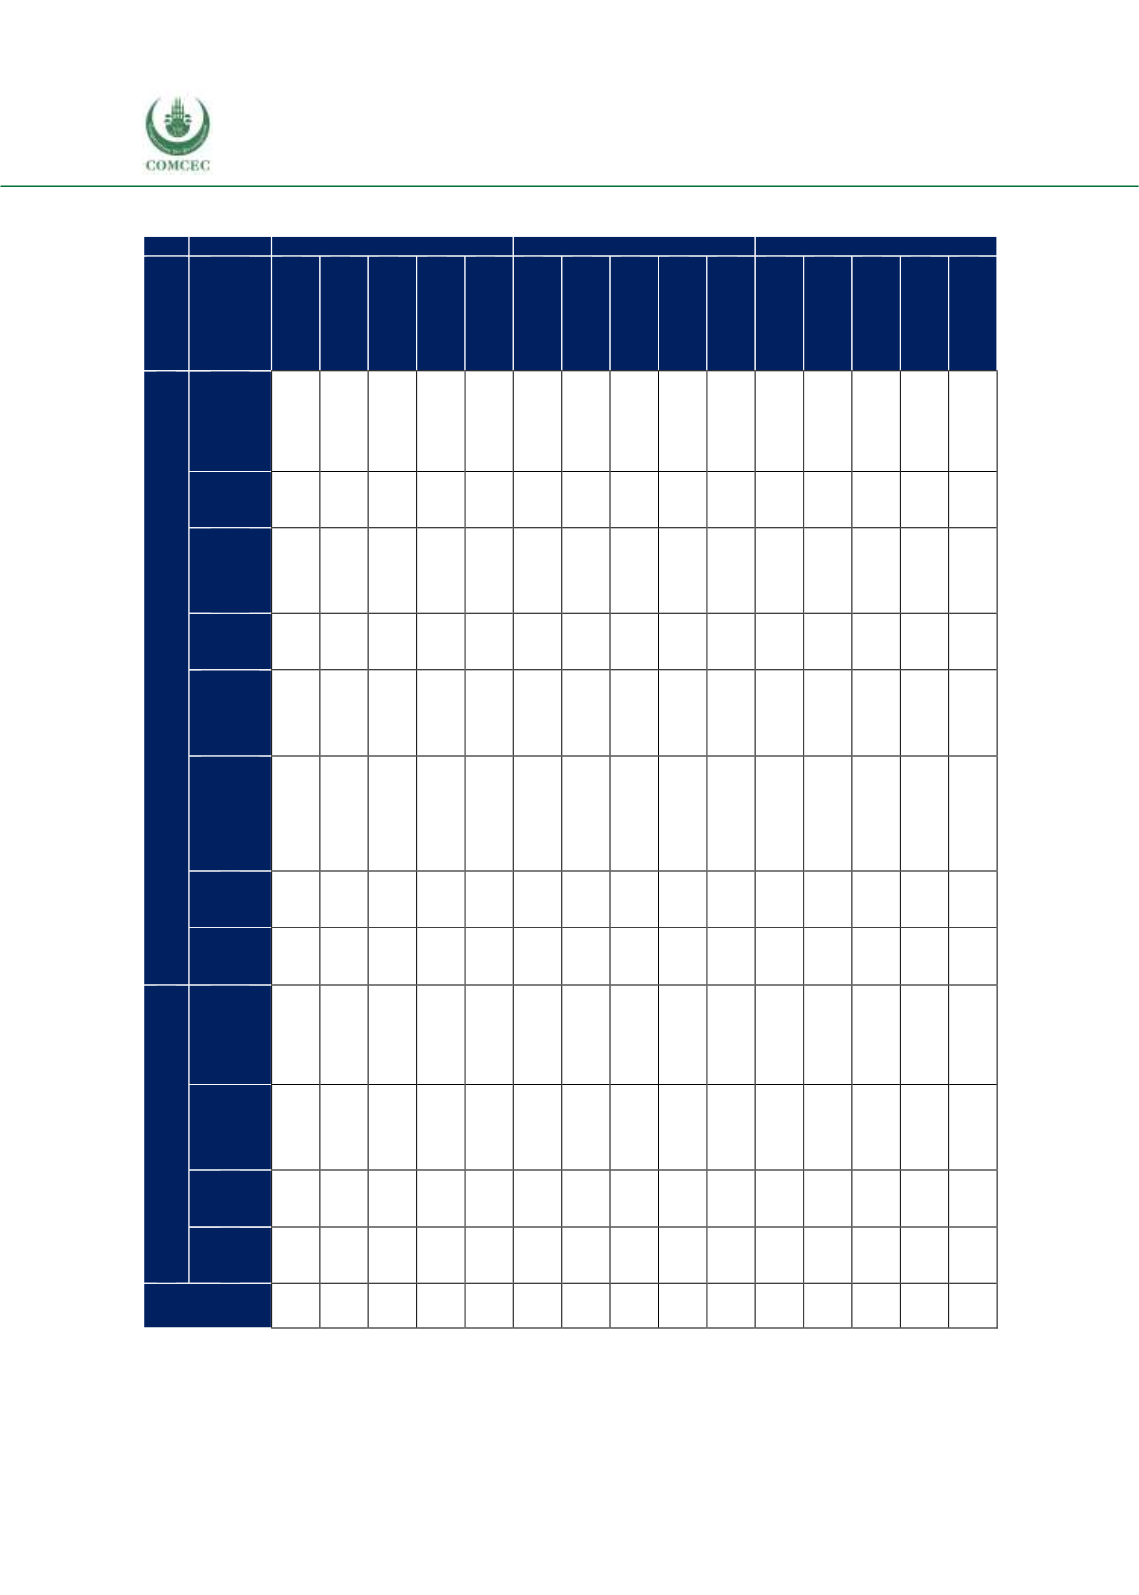
Table 2. 5 NTMs by Major Trading Blocs (Number of Measures Implemented)
Agri-food Products
Fish Products
Raw Materials
Imposing
member
NAFTA
MERCOSUR
ASEAN
EU-28
OIC
NAFTA
MERCOSUR
ASEAN
EU-28
OIC
NAFTA
MERCOSUR
ASEAN
EU-28
OIC
All Members
Export
Subsidies
23
74
1
114
40
41
2
QR
24
1
44
17
10
11
47
9
15
5
Safe
guards
6
SPS
84
137
224
4
300
9
12
31
153
1
3
3
1
Special
Safe
guards
496
11
305
7
2
State
Trading
Enterprises
4
6
1
8
1
17
1
TRQ
78
59
52
251
44
42
5
1
TBT
54
26
12
8
17
19
5
1
0
34
13
2
1
3
Bilateral
Anti-
Dumping
23
6
1
6
219
4
1
Counter
-veiling
5
1
1
QR
1
SPS
6
25
99
216
1
2
2
172
1
3
TOTAL
797
328
450
683
642
46
19
45
0
733
41
8
20
2
13
Source: WTO I-TIP, ITC Macmap, CEPII BACI, Eurostat RAMON, UN Comtrade, UN Trade Statistics, and
authors’ calculations.
Note: QR, SPS, TRQ, and TB, are the abbreviations of following terms, respectively: “Quantitative
Restrictions”, “Sanitary and Phytosanitary”, “Tariff-rate quotas”, and “Technical Barriers to Trade”