


 42 / 272

Reviewing Agricultural Trade Policies
To Promote Intra-OIC Agricultural Trade
30
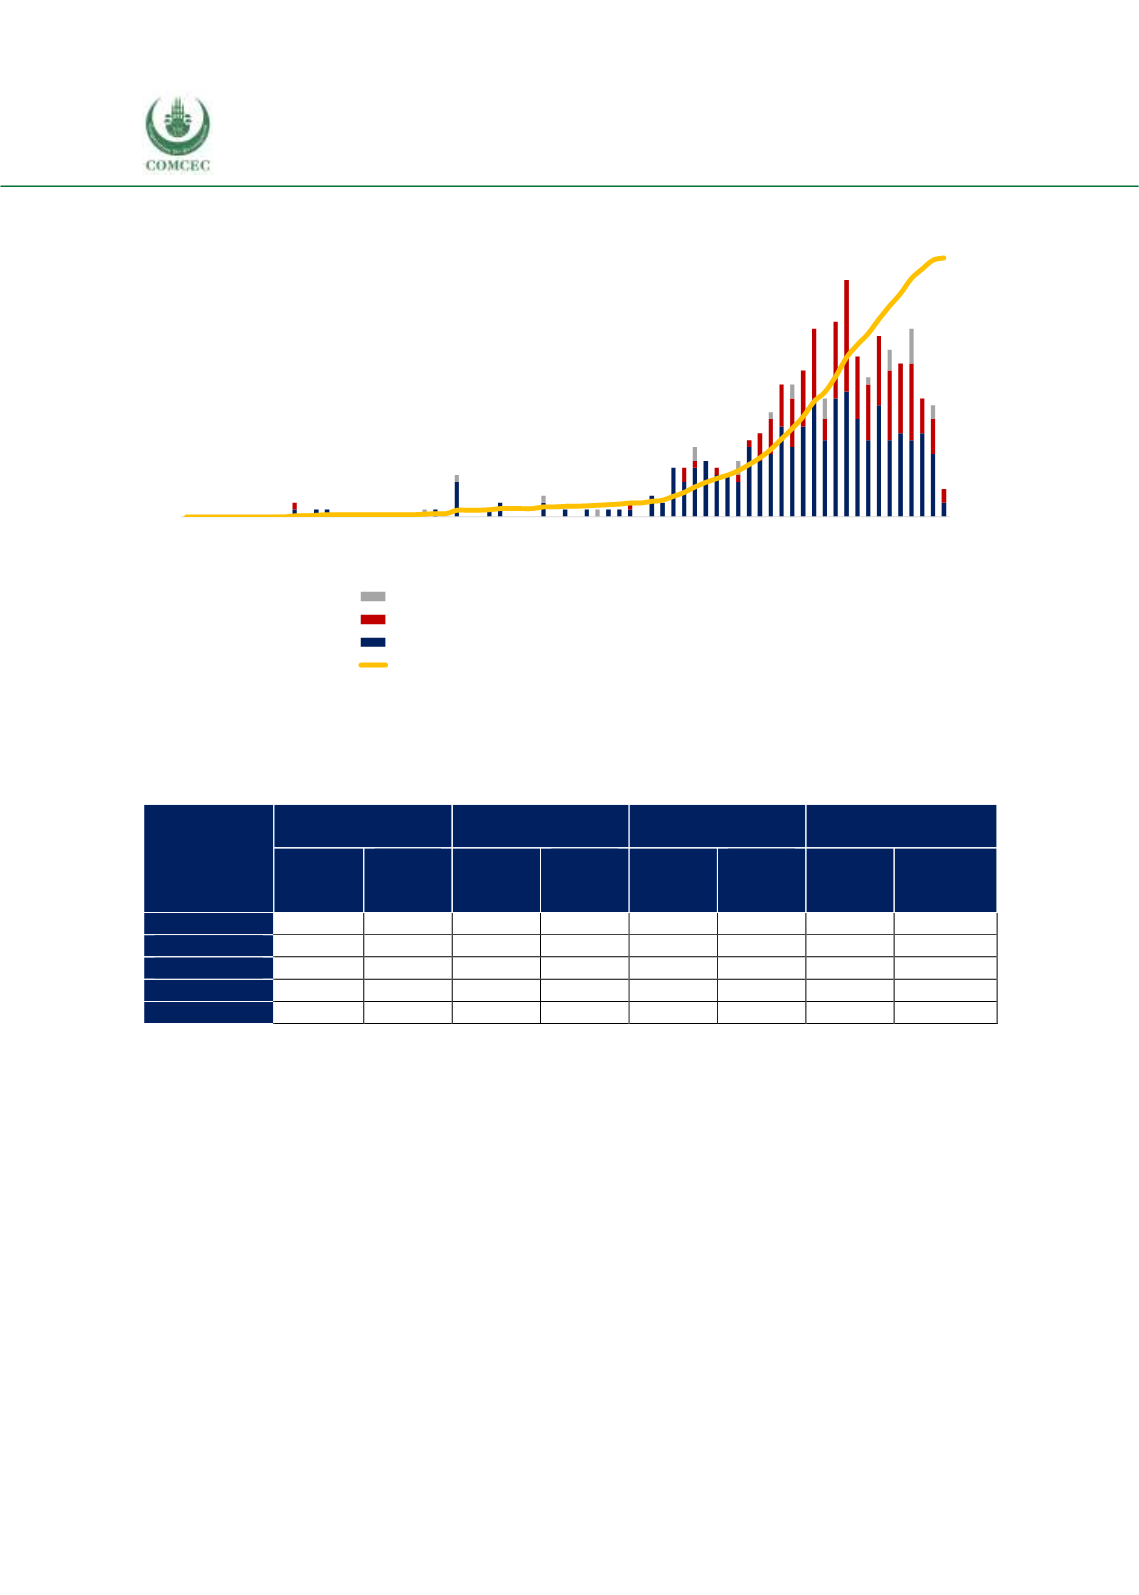
Figure 2. 11 Number Of Regional (Reciprocal) Trade Agreements In Force*, 1948–2018
Source: WTO Regional Trade Agreements Information System (RTA-IS), authors’ visualizations.
Note: * As of October 30, 2018
Table 2. 4 Average Tariff Rates across Trade Blocs, Ad Valorem Equivalent, %, 2016
Agri-Food
Fish
Agri-Raw
Agricultural
Products
Within
bloc
Outside
of the
bloc
Within
bloc
Outside
of the
bloc
Within
bloc
Outside
of the
bloc
Within
bloc
Outside of
the bloc
NAFTA
4.3
5.3
0.0
1.3
0.0
0.2
3.6
4.3
MERCOSUR
0.7
11.3
0.0
3.6
0.0
5.3
0.6
9.6
ASEAN
4.7
10.4
0.1
6.1
0.4
0.5
4.0
8.9
EU-28
0.0
6.6
0.0
4.5
0.0
0.1
0.0
5.7
OIC
7.6
11.0
5.6
7.3
1.4
1.2
7.2
10.1
Source: ITC Macmap, ITC Macmap, CEPII BACI, Eurostat RAMON, UN Comtrade, UN Trade Statistics, and
authors’ calculation
s
The European Union as an economic integration at a much further stage than a customs union
has no tariffs in its intra-EU trade. However, EU applies still a higher average tariff rate (5.7%)
than NAFTA (4.3%) with the lowest average tariff rate for all agricultural products among the
blocs studied. The situation changes somehow when the three categories are considered
separately and also with regard to internal tariffs vs. the one applied to the outside. NAFTA
applies a tariff of 4.3%within the bloc to agricultural food products vs. no tariff in intra-EU trade
within this category, and also a higher tariff than EU to the agricultural raw materials imported
from outside (0.2% by NAFTA vs. 0.1% by EU). The highest average tariff rate applied in
agricultural food products to the outside is by MERCOSUR with 11.3%exceeding slightly the one
of OIC countries. For the imports of fish category, the highest tariff rate to the outside is by OIC.
The most important outcome of this analysis is the fact that the highest average tariff rates
applied within the bloc is by OIC member countries and in all three categories. This report aims
to study how to develop policies to tackle with this problem having major negative
consequences on the economic welfare of OIC member states.
0
50
100
150
200
250
300
350
400
450
500
0
5
10
15
20
25
30
35
40
1948
1950
1952
1954
1956
1958
1960
1962
1964
1966
1968
1970
1972
1974
1976
1978
1980
1982
1984
1986
1988
1990
1992
1994
1996
1998
2000
2002
2004
2006
2008
2010
2012
2014
2016
2018
Accessions to an RTA, left axis
Services notifications, left axis
Goods notifications, left axis
Cumulative Notifications of RTAs in force, right axis