


 49 / 272

Reviewing Agricultural Trade Policies
To Promote Intra-OIC Agricultural Trade
37
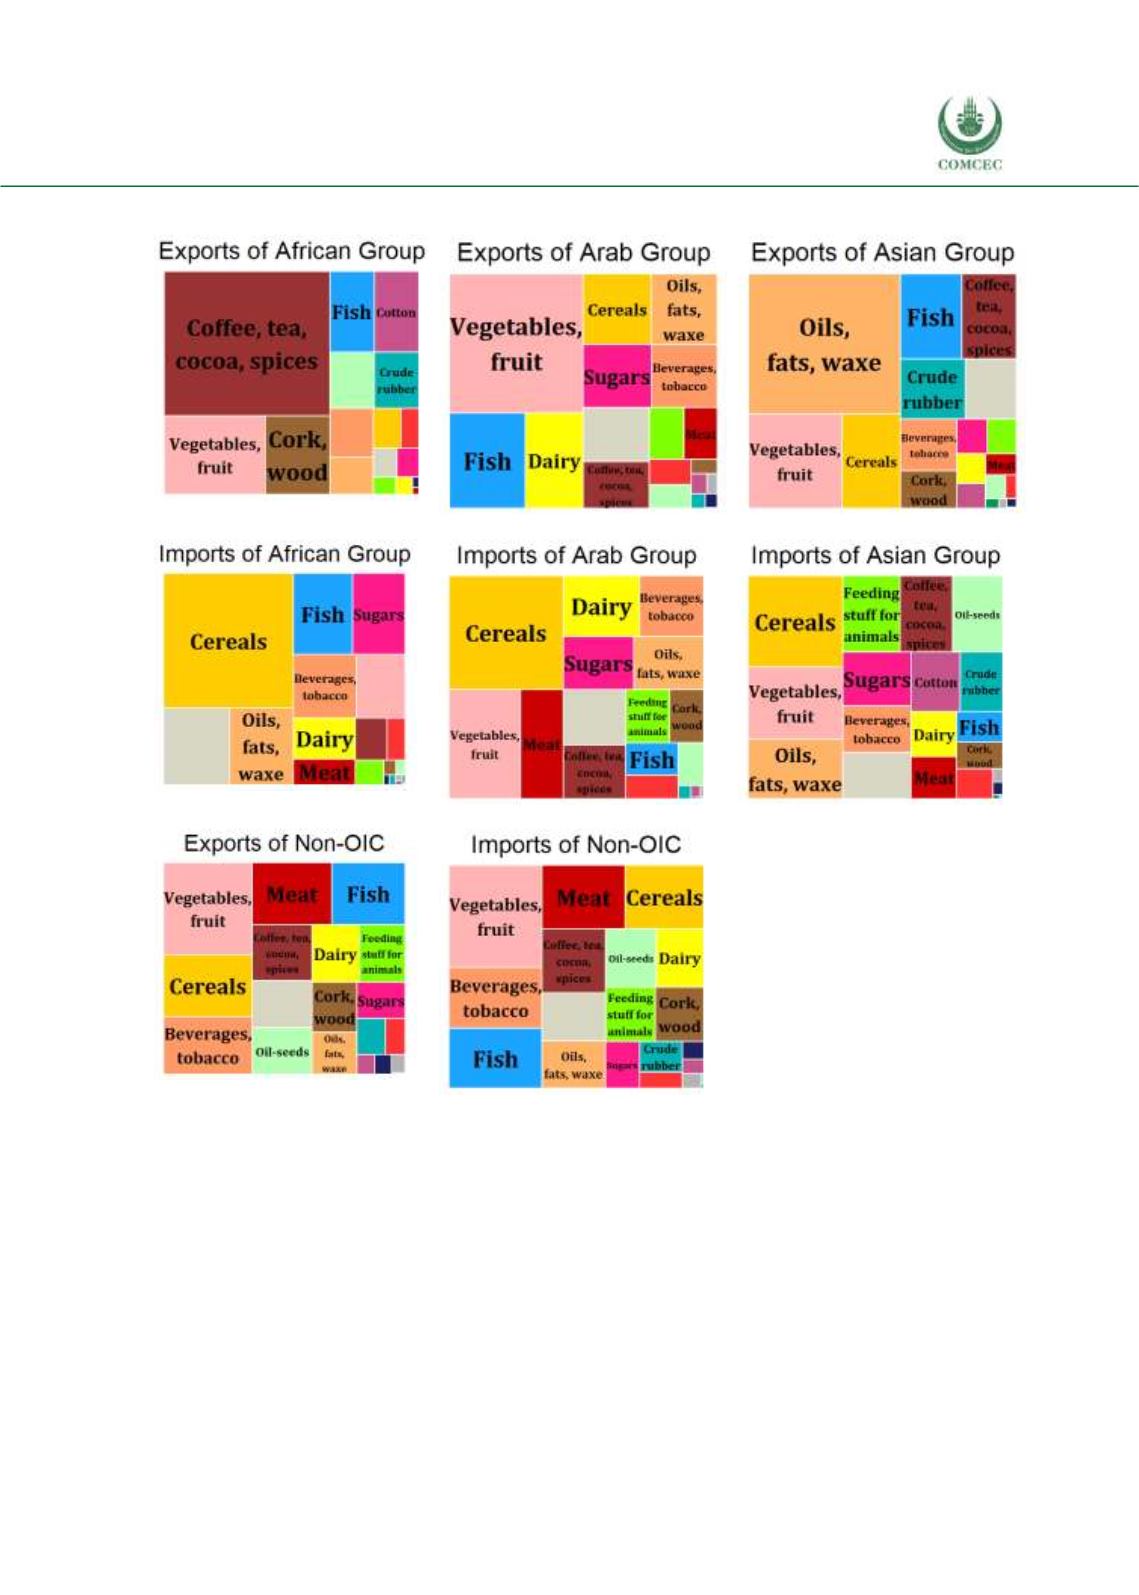
Figure 3. 5 Breakdown of Agricultural Trade by Geographic Groups and Divisions, 2016
Source: ITC Macmap, CEPII BACI, Eurostat RAMON, UN Comtrade, UN Trade Statistics, and authors’
calculations
3.1.2. Agricultural trade of the OIC groups by countries of origin and destinations
This section presents the agricultural exports and imports of the OIC country groups according
to their top 5 export product divisions identified above. Figure 3.6 demonstrates the export
destinations for the top 5 export product divisions of the African group countries according to
OIC country groups and non-OIC countries. The figure shows that, among the OIC country
groups, the Asian group is the top destination of the African group exports. The share of the
Asian group in the African group’s top 5 agricultural exports increased from 3.9% in 2008 to
6.3% in 2016. Nonetheless, the shares of the African and Arab countries are lower than the Asian
group’s share, with percentage shares of 3.0% and 2.9% in 2016, respectively. The share of non-