


 50 / 272

Reviewing Agricultural Trade Policies
To Promote Intra-OIC Agricultural Trade
38
OIC countries in African exports declined slightly during the last decade in favor of the OIC group
countries (see Table F.5 in Annex F).
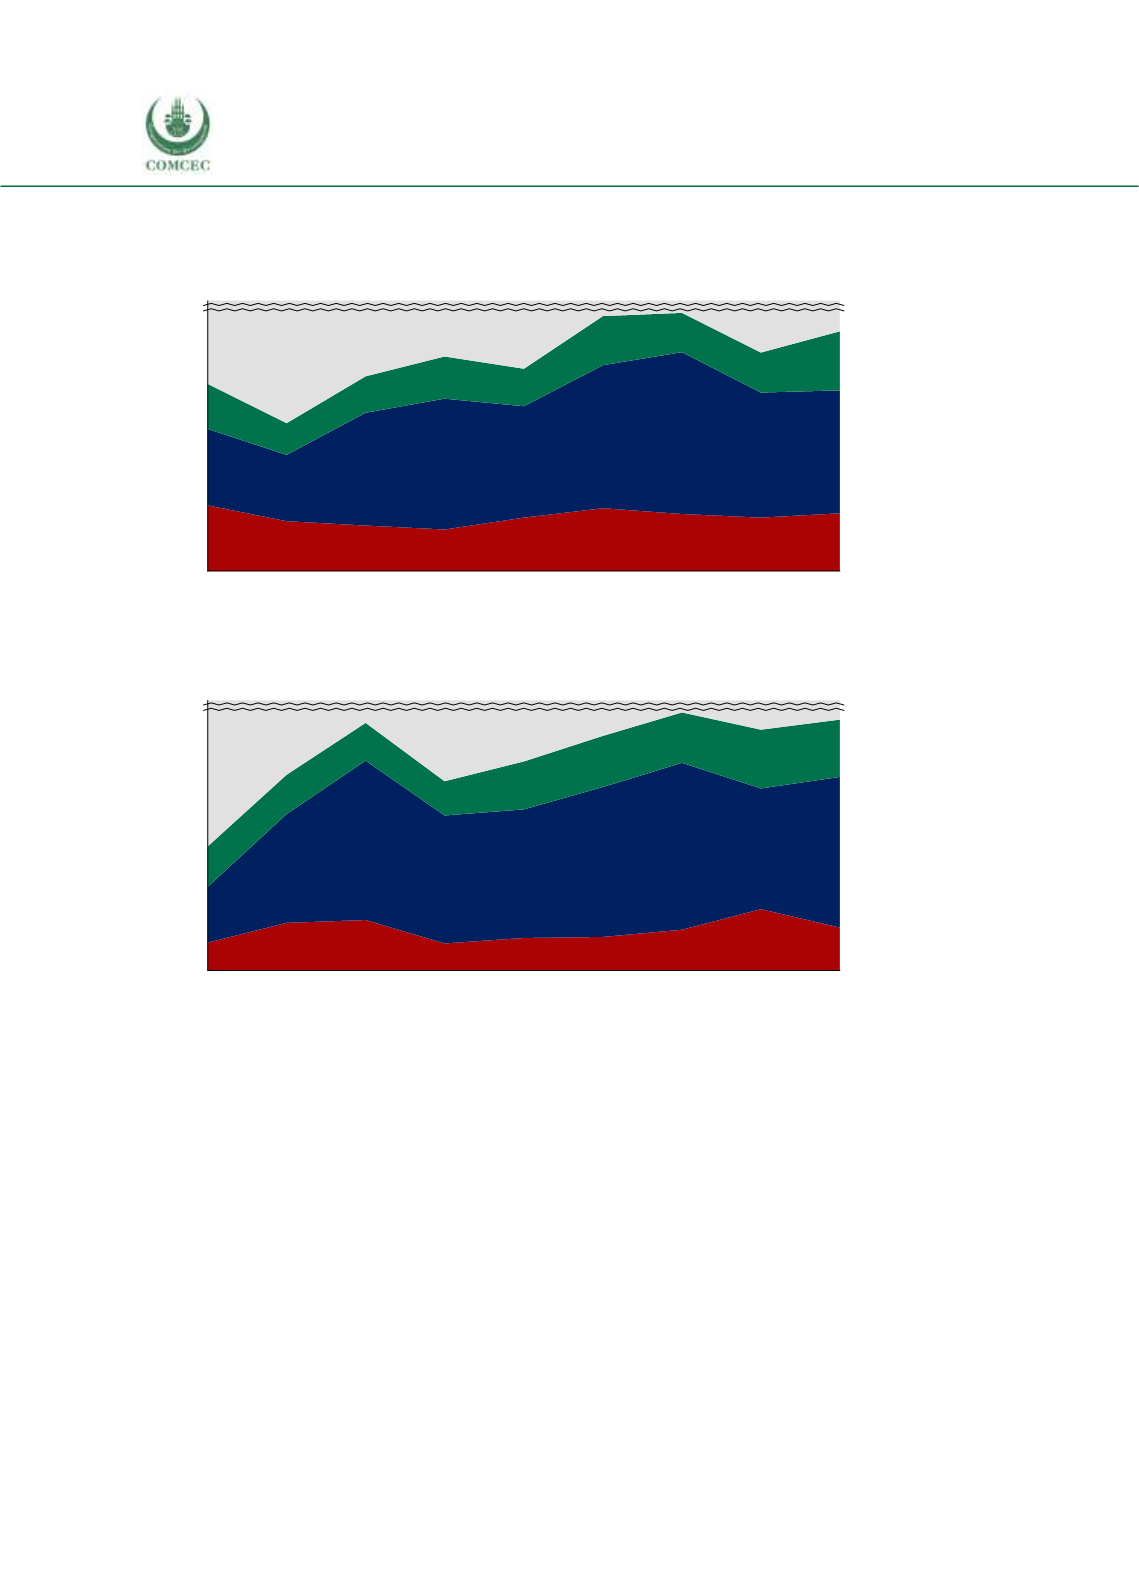
Figure 3. 6 Destination of Top 5 Export Products of African Group
Source: ITC Macmap, CEPII BACI, Eurostat RAMON, UN Comtrade, UN Trade Statistics, and authors’
calculations. Note: Top 5 products are identified considering 3 year average between 2014 and 2016.
Figure 3. 7 Origin of Top 5 Import Products of African Group
Source: ITC Macmap, CEPII BACI, Eurostat RAMON, UN Comtrade, UN Trade Statistics, and authors’
calculations. Note: Top 5 products are identified considering 3 year average between 2014 and 2016.
A similar trend is observed with regards to agricultural imports to the African group. The share
of the non-OIC group has a slight decrease while the share of OIC countries increased. Figure 3.7
shows the country groups of origins for the African group countries’ top import products. The
figures reveal that the African group’s agricultural imports predominantly come from the Asian
group countries. For instance, the share of the Asian group in Africa’s imports have increased
from 5.7% in 2008 to 15.3% in 2016. The share of the African group remained 5.8%, and the
share of the Arab group had been 4.4% in 2016, respectively (see Table F.6 in Annex F).
With regards to the Asian group countries, the share of the non-OIC countries in agricultural
exports and agricultural imports showed a sharp decrease in 2011. The reason might be related
to the consequences of the global financial crisis starting from 2008 to 2011 which could have
caused the falling share of non-OIC group in Asian trade. Agricultural trade is not an exception
in this regard, and especially because the Asian group countries export large volumes of
agricultural raw materials. On the other hand, while the global economic crisis hit Asian
100%
0%
10%
5%
2008
2011
2009
Asian group
2012
2010
African group
2013 2014 2015 2016
Arab group
Non-OIC countries
100%
0%
10%
5%
25%
15%
20%
Arab group
Asian group
2014
Non-OIC countries
2008 2009 2010
2015
2011 2012 2013
2016
African group