


 168 / 272

Reviewing Agricultural Trade Policies
To Promote Intra-OIC Agricultural Trade
156
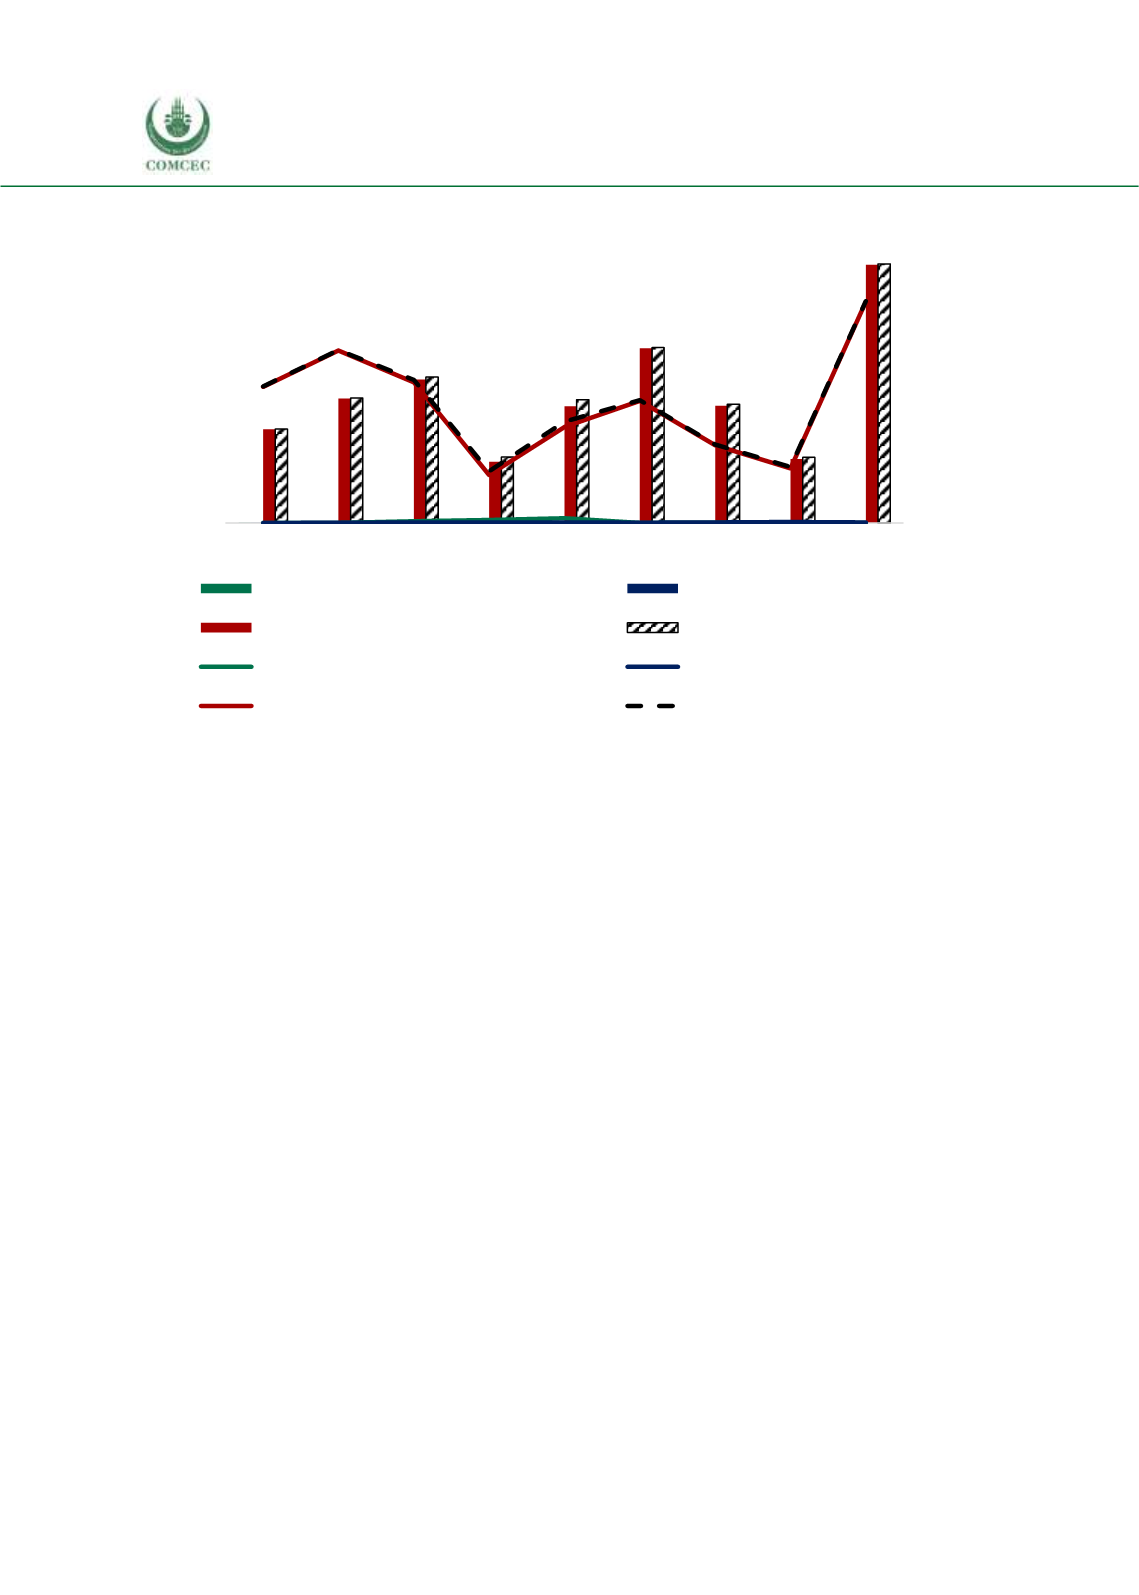
Figure 4. 71 Imports of Brazil’s Fish Products from the OIC Groups
Source: CEPII BACI, Eurostat RAMON, UN Comtrade, UN Trade Statistics, and authors’ calculations
In summary;
Brazil’s weak economic performance after 2012 and the depreciation of Brazillian Real
during the period affected its trade with OIC countries, declining the volume of Brazil’s
imports and exports.
The Arab group has the highest share in Brazil’s agri-food exports with a share of 12.5%
in 2016, followed by the Asian group and the African group with respective shares of
9.3% and 1.6%.
The Asian group has the highest share in Brazil’s agri-food imports with a share of 5.5%
in 2016, followed by the Arab and the African group with respective shares of 0.5% and
0.3%.
The Asian group has the highest share in Brazil’s agricultural raw material exports with
a share of 24.9% in 2016, followed by the Arab and the African group with respective
shares of 2% and 0%.
The Asian group has the highest share in Brazil’s agricultural rawmaterial imports with
a share of 19.3% in 2016, followed by the African group and the Arab group with
respective shares of 2.5% and 0.4%.
The Arab group has the highest share in Brazil’s fish product exports with a share of
12.8% in 2016, followed by the African group and the Arab group with respective shares
of 1% and 0.1%.
The Arab group has the highest share in Brazil’s fish product imports with a share of
4.7% in 2016, followed by the Asian and the African group with shares of 0% each.
0
10
20
30
40
50
60
0
1
2
3
4
5
6
2008 2009 2010 2011 2012 2013 2014 2015 2016
African Group (million USD)
Asian Group (million USD)
Arab Group (million USD)
OIC Total (million USD)
African share in total fish imp. (%)
Asian share in total fish imp. (%)
Arab share in total fish imp. (%)
OIC share in total fish imp.
(%)
million USD
%