


 170 / 272

Reviewing Agricultural Trade Policies
To Promote Intra-OIC Agricultural Trade
158
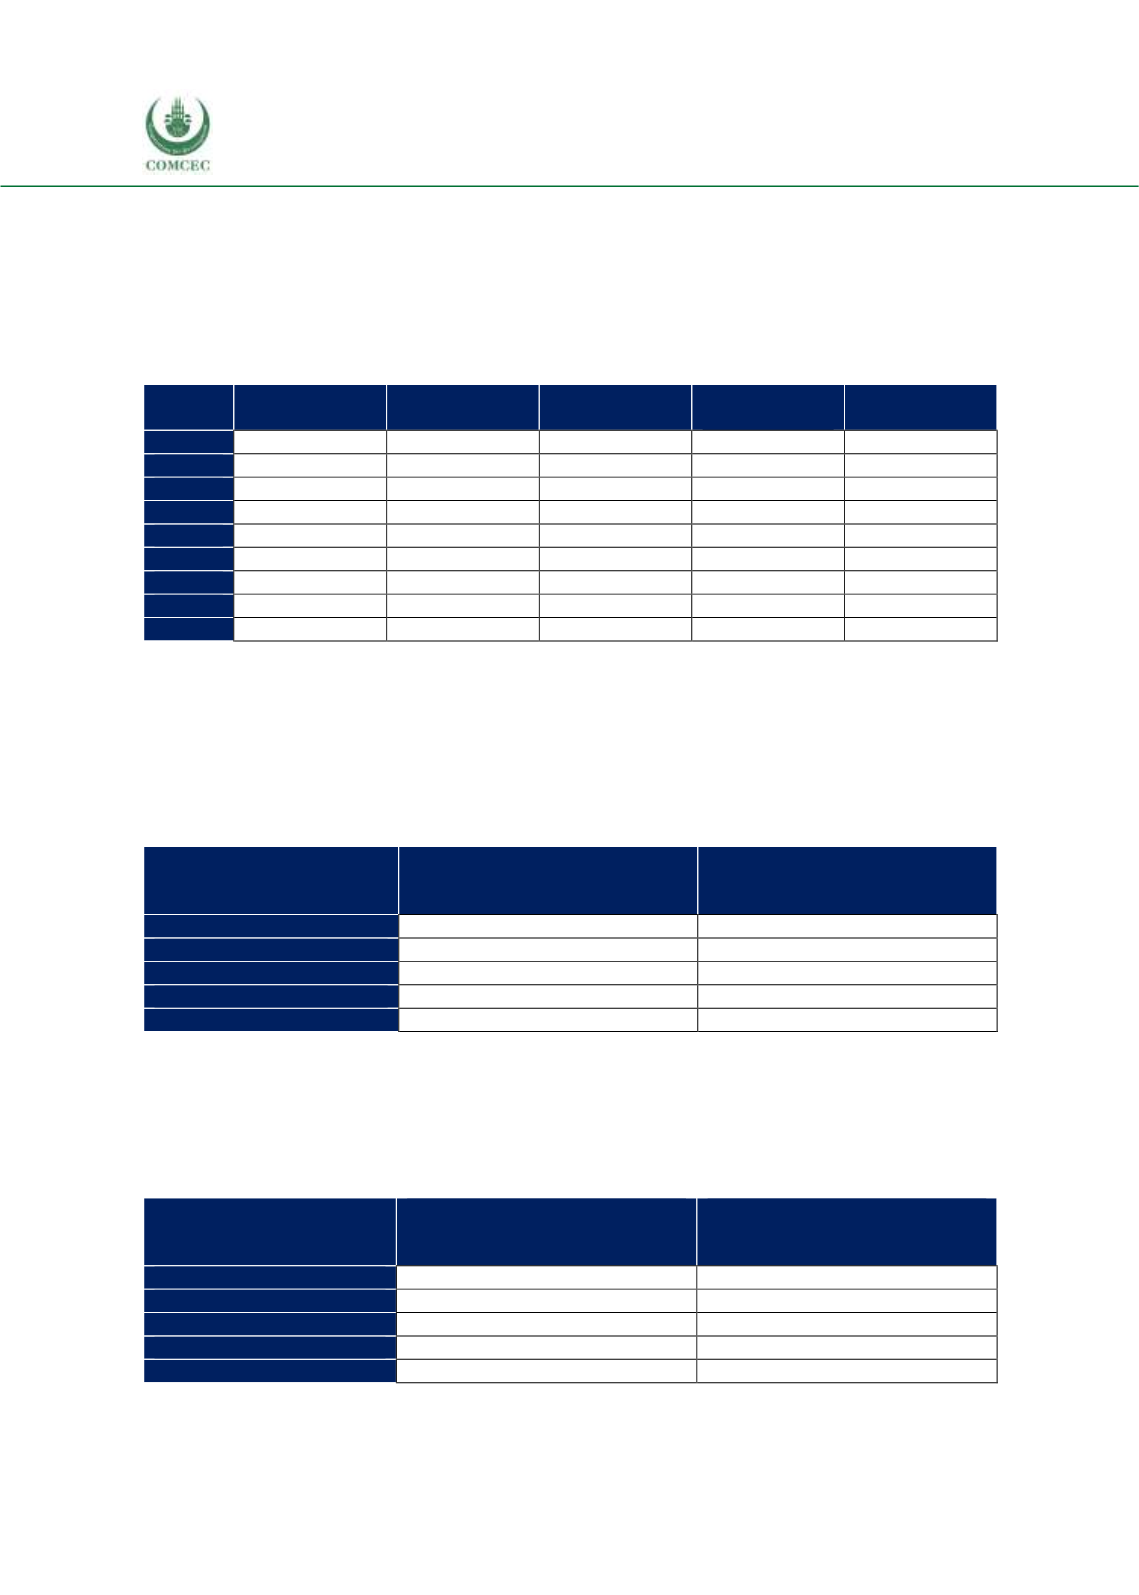
Table 4.59 shows the distribution of top 5 agricultural import products from the OIC countries
according to the region of origin. Nearly all of Brazil’s top agricultural product imports are from
non-OIC countries, despite a slight decrease from 99.9% in 2008 to 99.3% in 2016. The major
part of the slight increase in OIC countries’ share came from the Asian group, with an increase
from around 0% to 0.4% during the 2008-2016 period, while the shares of African and Asian
groups did not change much.
Table 4. 59 Distribution of Brazil’s Top 5 Import Products, by Origin, %
African group
Asian group
Arab group
Non-OIC
Countries
Total
2008
0.0
0.0
0.1
99.9
100
2009
0.8
0.0
0.3
98.9
100
2010
0.9
0.1
1.1
98.0
100
2011
1.4
0.1
0.3
98.2
100
2012
1.4
0.1
0.1
98.4
100
2013
0.2
0.1
0.1
99.5
100
2014
0.2
0.2
0.1
99.5
100
2015
0.5
0.4
0.0
99.1
100
2016
0.2
0.4
0.2
99.3
100
Source: CEPII BACI, Eurostat RAMON, UN Comtrade, UN Trade Statistics, and authors’ calculations
Table 4.60 shows that Saudi Arabia is the largest importer of Brazil’s top five agricultural
products in the OIC market. The share of Saudi Arabia in the last available three-year average is
14.2%, while the second largest market (Iran) has a share of 11.7%. The third largest market is
Egypt with a share of 10.7%, followed by the United Arab Emirates and Indonesia with their
respective shares of 8.8% and 8%.
Table 4. 60 Top 5 OIC Destination Countries for Brazil’s Top 5 Export Products
Importer OIC country
Value of agricultural exports to
the country, billion USD, last 3-
year average
% share in total agricultural
exports to the OIC countries,
last 3-year average
Saudi Arabia
2.1
14.2
Iran
1.7
11.7
Egypt
1.6
10.7
UAE
1.3
8.8
Indonesia
1.2
8.0
Source: CEPII BACI, Eurostat RAMON, UN Comtrade, UN Trade Statistics, and authors’ calculations
Table 4.61 shows the first five markets that Brazil purchases the top five import products.
Indonesia is the largest market for Brazil’s top five agricultural product imports from the OIC
countries with a share of 64.8%, followed by Malaysia, Cote d’Ivoire, Turkey, and Morocco.
Table 4. 61 Top 5 OIC Origin Countries of Brazil’s Top 5 Import Products
Exporter OIC country
Value of agricultural imports
from the country, billion USD,
last 3-year average
% share in total agricultural
imports from the OIC countries,
last 3-year average
Indonesia
0.5
64.8
Malaysia
0.1
12.3
Cote d'Ivoire
0.1
7.9
Turkey
0.1
7.2
Morocco
0.0
3.4
Source: CEPII BACI, Eurostat RAMON, UN Comtrade, UN Trade Statistics, and authors’ calculations