


 171 / 272

Reviewing Agricultural Trade Policies
To Promote Intra-OIC Agricultural Trade
159
4.6.2. Agricultural Trade Policies in Brazil
Background
Trade policies in Brazil in terms of preferential trade agreements have been influenced by the
Southern CommonMarket (MERCOSUR), Global Systemof Trade Preferences among Developing
Countries (GSTP), Latin American Integration Association (LAIA), and Southern African Customs
Union (SACU) policies. The free trade agreements are developed in parallel to the MERCOSUR’s
agreement with Southern African Customs Union (SACU). Currently, Brazil is part of free trade
agreements with 51 countries worldwide including 19 OIC member countries (Algeria,
Bangladesh, Benin, Cameroon, Egypt, Guinea, Guyana, Indonesia, Iran, Iraq, Libya, Malaysia,
Morocco, Mozambique, Nigeria, Pakistan, Sudan, Tunisia, and Turkey) (WTO, RTA-IS).
The Brazilian economy is mainly inward oriented, with exports and imports in goods and
services representing about 25% of GDP. European Union continues to be Brazil's main supplier
and a key destination market, although in 2015 China became the single most important
destination for Brazilian merchandise exports (WTO, 2017b).
According to the WTO 2017 Trade Policy Review, the country is undertaking trade reform
initiatives to support growth. Those are trade facilitation, anti-dumping, production and trade
incentives (e.g., SME support), state-owned enterprises, energy, manufacturing, transport
infrastructure, and more being under consideration.
The tariff are still Brazil's main trade policy instrument. Brazil applies the MERCOSUR Common
External Tariff (CET), with some country-specific derogations. Brazil bound its entire tariff
during the Uruguay Round at rates between zero and 55% for agricultural products (WTO
definition). The gap between the average bound and applied rates is some 18.5 percentage
points (WTO, 2017b).
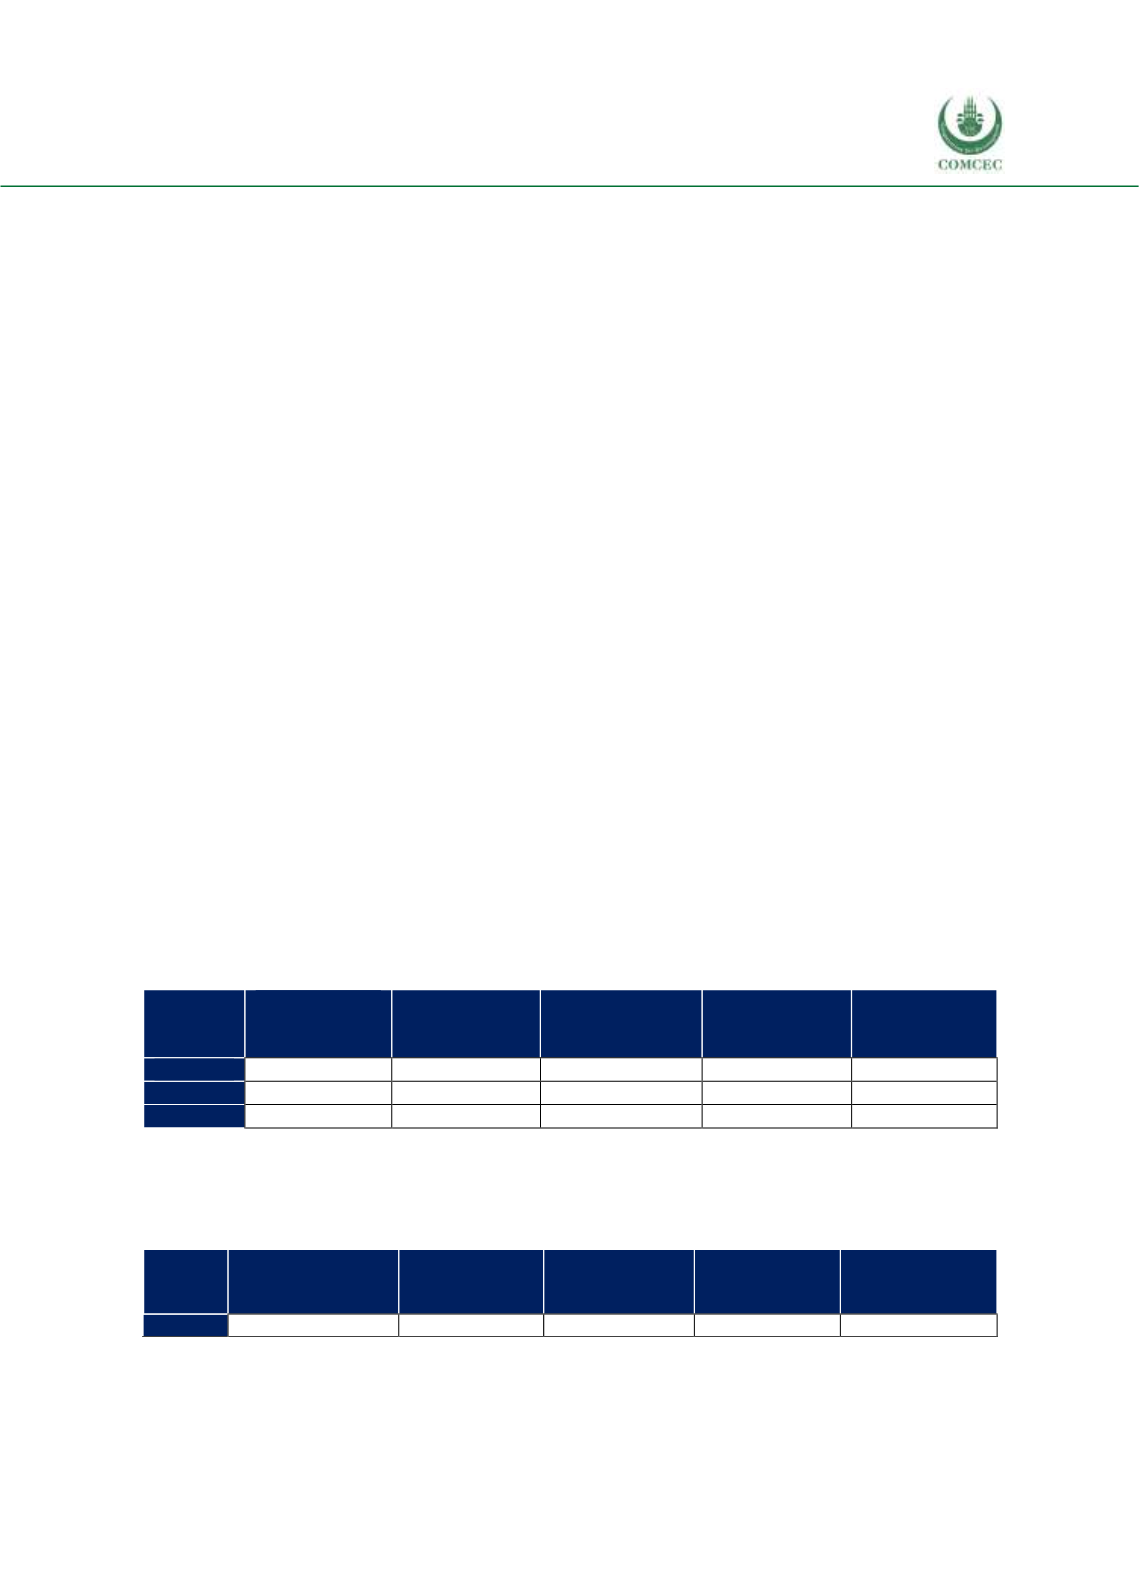
Brazil’s applied tariff rates to its top 5 agricultural product groups imported from the top 5 OIC
exporters vary between 4 percent (crude rubber) and 20.3 percent (vegetables, fruit), the last
one having increased during the last three years. Such an increasing trend is not observed in the
other 4 product groups Table 4.62).
Table 4. 62 Tariffs Set by Brazil For Top 5 Import Products from the OIC Exporters, %
41-42-43:
Oils, fats,
waxe
23: Crude
rubber
05: Vegetables,
fruit
07: Coffee, tea,
cocoa, spices
03: Fish
2014
10.0
4.0
15.6
12.0
10.6
2015
11.0
4.0
16.2
12.0
10.4
2016
10.9
4.0
20.3
11.6
10.0
Source: ITC Macmap, CEPII BACI, Eurostat RAMON, UN Comtrade, UN Trade Statistics, and authors’
calculations
Note. Top 5 products are identified considering 3 year average between 2014 and 2016 and ad valorem
equivalent (%) rates are considered for applied tariff rates.
Table 4. 63 Tariffs Set by OIC Countries for Brazil’s Top 5 Export Products, %
09: Miscellaneous
p.
41-42-43: Oils,
fats, waxe
08: Feeding
stuff for
animals
02: Dairy
11-12:
Beverages,
tobacco
2016
15.7
20.0
-
9.9
19.4
Source: ITC Macmap, CEPII BACI, Eurostat RAMON, UN Comtrade, UN Trade Statistics, and authors’
calculations
Note. Top 5 products are identified considering 3 year average between 2014 and 2016 and ad valorem
equivalent (%) rates are considered for applied tariff rates.