


 164 / 272

Reviewing Agricultural Trade Policies
To Promote Intra-OIC Agricultural Trade
152
Exports to the Arab group increased from 6 billion USD in 2008 to 8.9 billion USD in 2016,
representing an increase in share from 10.2% to 12.1% from 2008 to 2016. The Arab group has
the largest share in agricultural exports, followed by the Asian and the African group. Exports to
the Asian group increased from 2.8 billion USD in 2008 to 7.2 billion USD in 2016 (157%
increase), with a percentage share increase from 4.8% to 9.9% during the 2008-2016 period.
The African group’s share has been relatively stable during the period, changingwithin the range
of 1.3% to 2.2%.
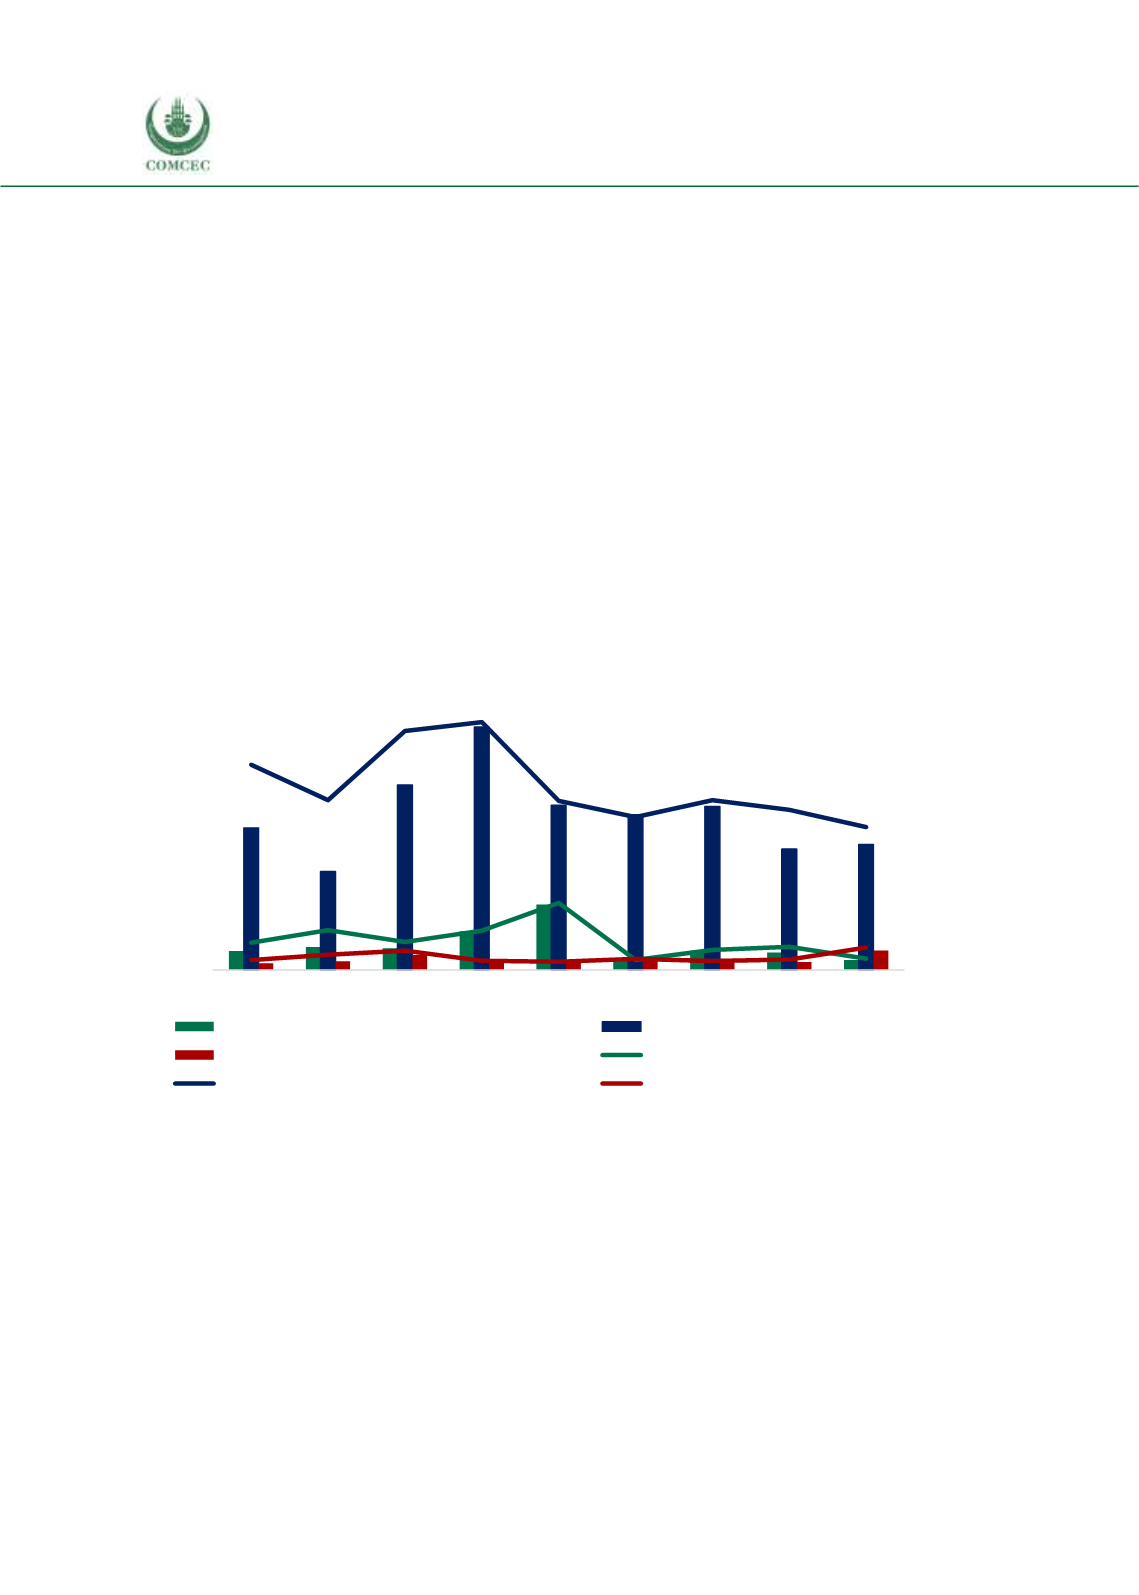
Figure 4.65 illustrates the distribution of Brazil’s agricultural imports according to the three OIC
country groups. The percentage share of imports from the African group has been within the
range of 0.4% and 2.8% during the 2008-2016 period. The share of Brazil’s agricultural imports
from the Arab group has been relatively stable throughout the period, reflecting a percentage
share of 0.5% to 1%. The Asian group has the largest share in Brazil’s agricultural imports, but
the share is declining. The share of the Asian group in total imports decreased from8.7% in 2008
to 6% in 2016. The value of total imports from the Asian group decreased from 750 million USD
to 660 million USD from 2008 to 2016, after reaching a peak of 1.3 billion USD in 2011. The
sharp decline after 2011 reflects the depreciation of Brazillian Real, and Brazil’s weak economic
performance.
Figure 4. 65 Share of OIC Groups in Brazil’s Agricultural Imports
Source: CEPII BACI, Eurostat RAMON, UN Comtrade, UN Trade Statistics, and authors’ calculations
General overview
Figure 4.66 presents the agri-food product exports of Brazil with respect to country groups. OIC
countries are becoming a significant market for Brazil’s agri-food product exports, with its share
increasing from 16.7% in 2008 to 23.4% in 2016. The share of exports to the Arab group has
increased from 10.7% to 12.5% during the 2008-2016 period. The value of exports to the Asian
group increased from 2.4 billion USD to 6.5 billion USD (171% increase). The corresponding
share has increased from 4.4% to 9.3% within the period. The share of the African group was
within a range of 1.4% to 2.3%, reflecting the smallest share of the three country groups.
0
250
500
750
1.000
1.250
1.500
0
2
4
6
8
10
12
2008 2009 2010 2011 2012 2013 2014 2015 2016
African Group (million USD)
Asian Group (million USD)
Arab Group (million USD)
African share in total agricultural imp. (%)
Asian share in total agricultural imp. (%)
Arab share in total agricultural imp. (%)
million USD
%