


 167 / 272

Reviewing Agricultural Trade Policies
To Promote Intra-OIC Agricultural Trade
155
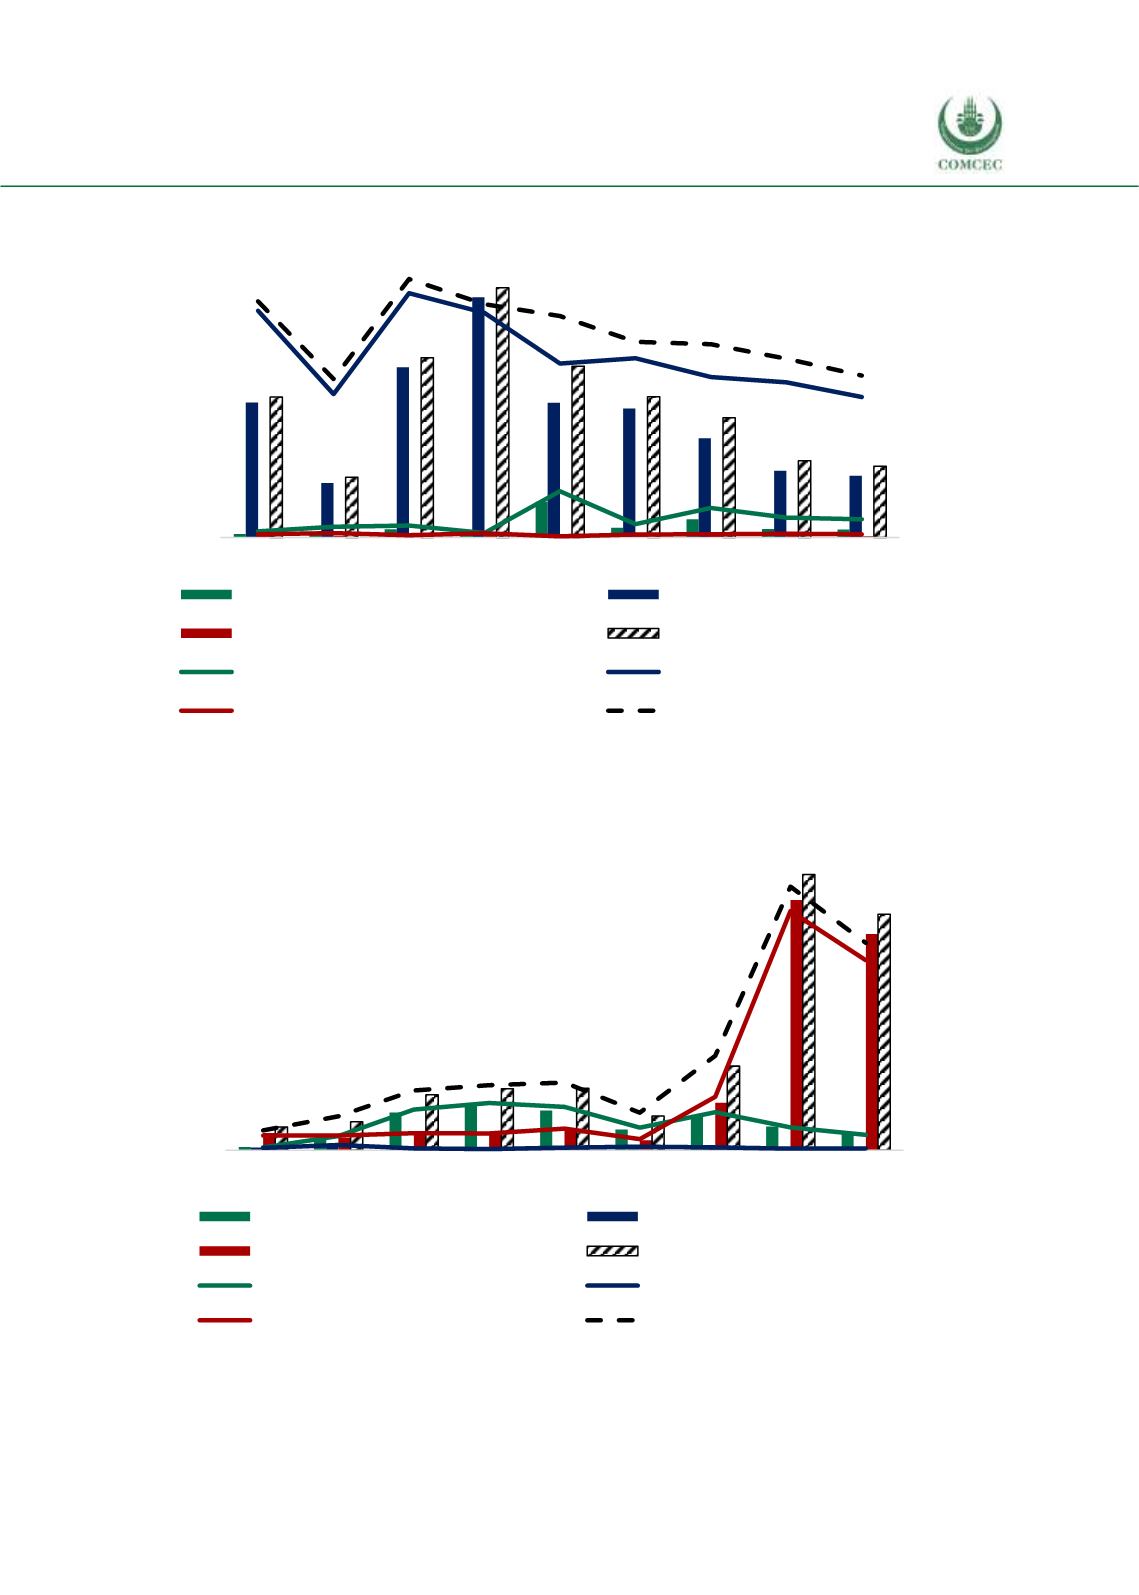
Figure 4. 69 Imports of Brazil’s Agricultural Raw Materials from the OIC Groups
Source: CEPII BACI, Eurostat RAMON, UN Comtrade, UN Trade Statistics, and authors’ calculations
Figure 4. 70 Exports of Brazil’s Fish Products to the OIC Groups
Source: CEPII BACI, Eurostat RAMON, UN Comtrade, UN Trade Statistic, and authors’ calculations
0
100
200
300
400
500
600
700
800
0
5
10
15
20
25
30
35
40
2008 2009 2010 2011 2012 2013 2014 2015 2016
African Group (million USD)
Asian Group (million USD)
Arab Group (million USD)
OIC Total (million USD)
African share in total agri-raw imp. (%)
Asian share in total agri-raw imp. (%)
Arab share in total agri-raw imp. (%)
OIC share in total agri-raw imp.
(%)
million USD
%
0
5
10
15
20
25
30
35
40
45
50
0
2
4
6
8
10
12
14
16
18
20
2008 2009 2010 2011 2012 2013 2014 2015 2016
African Group (million USD)
Asian Group (million USD)
Arab Group (million USD)
OIC Total (million USD)
African share in total fish exp. (%)
Asian share in total fish exp. (%)
Arab share in total fish exp. (%)
OIC share in total fish exp. (%)
million USD
%