


 169 / 272

Reviewing Agricultural Trade Policies
To Promote Intra-OIC Agricultural Trade
157
Top 5 Agricultural export and import products of Brazil in the OIC Markets
According to the latest available three-year averages (2014-2016), the products that have the
top five shares in Brazil’s total agricultural exports to the OIC countries are (top 5 agricultural
export products to the OIC):
06: Sugars
01: Meat
04: Cereals
08: Feeding stuff for animals
22: Oil-seeds
with percentage shares of 35.1%, 26.1%, 14.1%, 6.6%, and 5.2%, respectively.
With regards to Brazil’s top agricultural imports from the OIC countries, according to the latest
available three year averages (2014-2016), the products that have the top five shares in Brazil’s
total agricultural imports from the OIC countries are (top 5 agricultural import products to the
OIC):
41-42-43: Oils, fats, waxe
23: Crude rubber
05: Vegetables, fruit
07: Coffee, tea, cocoa, spices
03: Fish
with percentage shares of 40.4%, 25.7%, 13.1%, 6.4%, and 3.7%, respectively.
The products in the two lists are mutually exclusive. The commonly exported products fromOIC
countries are not commonly imported by Brazil.
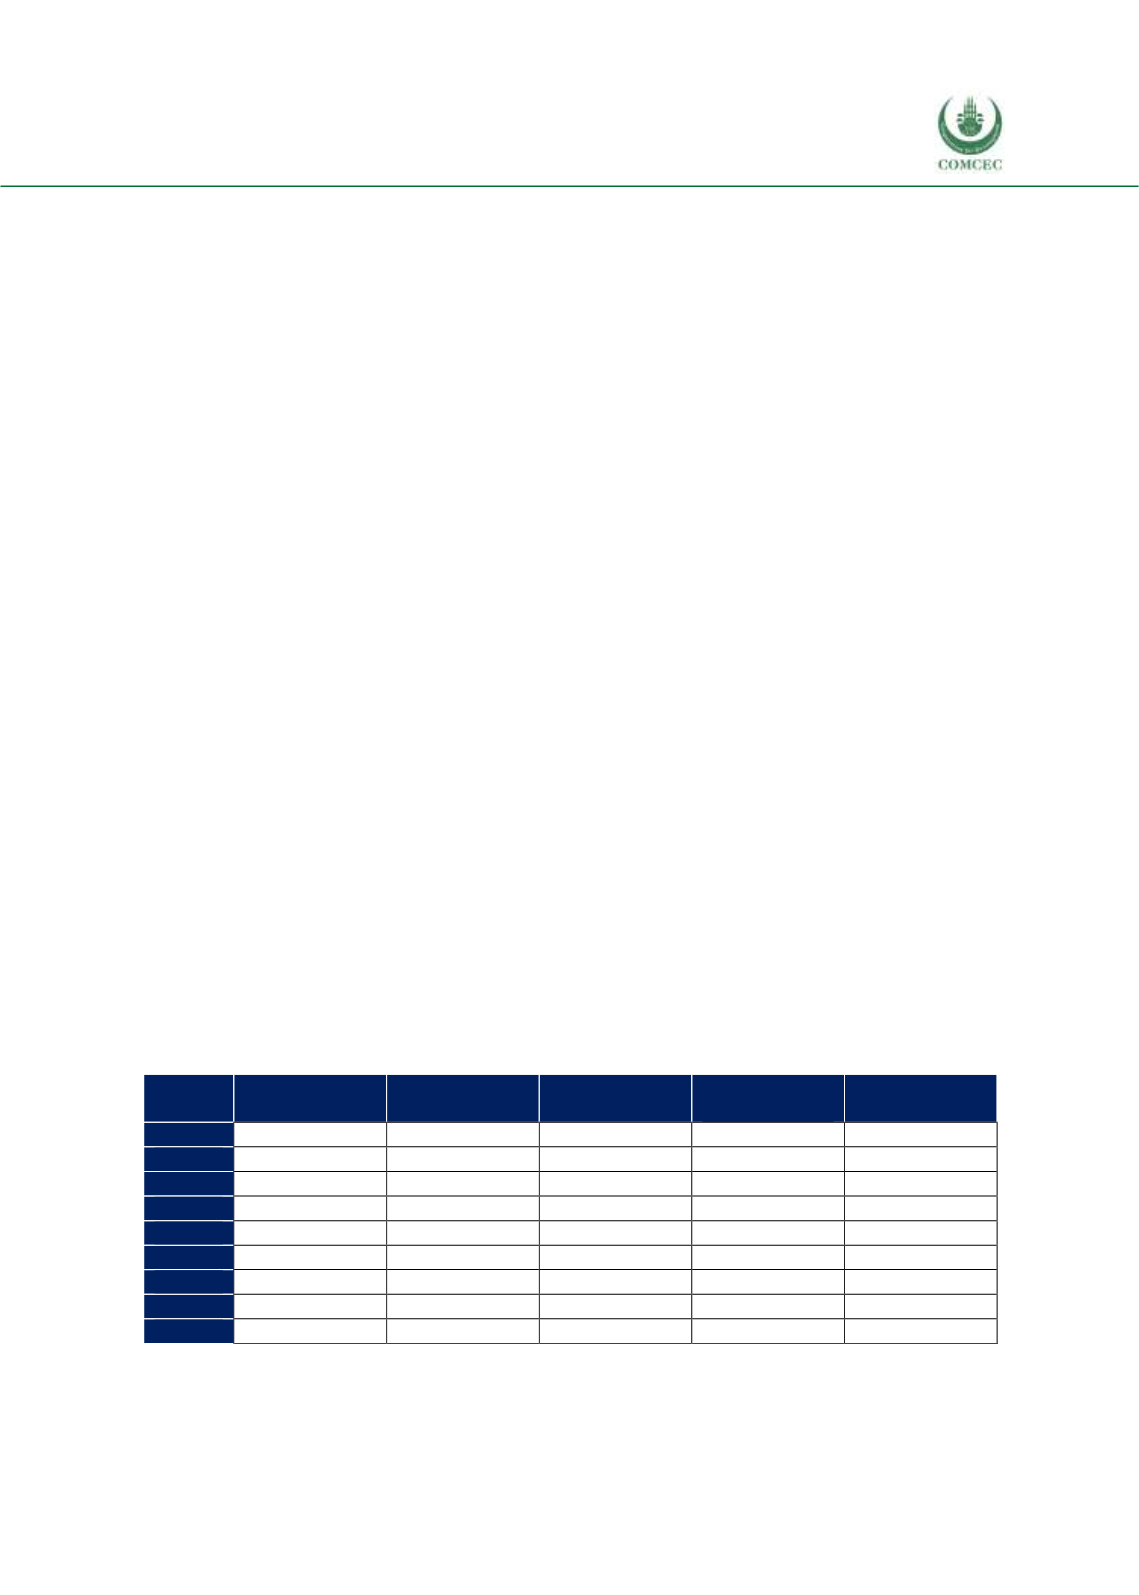
Table 4.58 shows the distribution of the total export value of the top 5 export products to the
OIC countries according to destinations. The share of non-OIC countries in total OIC exports of
top five agricultural export products declined from 80% in 2008 to 72.7% in 2016. The Asian
group’s share has shown the greatest increase during the observation period. The Asian group’s
share increased from 4.7% in 2008 to 10.7% in 2016 in total exports at the expense of non-OIC
countries. The share of the Arab group slightly increased from 13.2% in 2008 to 14.7% in 2016,
while the African group’s share did not change much.
Table 4. 58 Distribution of Brazil’s Top 5 Export Products, by Destination, %
African group
Asian group
Arab group
Non-OIC
Countries
Total
2008
2.0
4.7
13.2
80.0
100
2009
2.7
6.6
15.5
75.2
100
2010
2.4
9.7
17.2
70.7
100
2011
3.0
8.1
16.8
72.1
100
2012
2.7
7.6
16.9
72.8
100
2013
2.0
7.2
14.6
76.2
100
2014
1.9
7.9
13.4
76.8
100
2015
1.7
8.7
14.4
75.2
100
2016
1.9
10.7
14.7
72.7
100
Source: CEPII BACI, Eurostat RAMON, UN Comtrade, UN Trade Statistics, and authors’ calculations