


 163 / 272

Reviewing Agricultural Trade Policies
To Promote Intra-OIC Agricultural Trade
151
4.6.1. Agricultural Trade with the OIC Countries
Table 4.57 presents the figures related to the agricultural trade flows of Brazil with OIC
countries. Brazil’s agricultural exports to OIC increased from 9.7 billion USD in 2008 to 17.2
billion USD in 2016 with a percentage share increase from 16.6% to 23.5%. Brazil has a trade
surplus in agriculture, with the total value of its agricultural imports from OIC countries being
smaller than its exports. The value of Brazil’s agricultural imports from OIC countries has been
within the range of 0.7 billion USD to 1.5 billion USD during the 2008-2016 period. The
percentage share of agricultural imports declined from 10.3% in 2008 to 7.5% in 2016. The
decline of agricultural imports from 1.3 billion USD in 2012 to 0.8 billion USD in 2016 reflects
the recession period of the Brazillian economy from 2014 to 2016, and the depreciation of
Brazillian Real during the period of 2012-2016.
Table 4. 57 Value & Share of OIC Countries in Brazil’s Agricultural Trade
Year
Value (exports)
billion USD
Share in Brazil’s
total agricultural
exports, %
Value, (imports)
billion USD
Share in Brazil’s
total agricultural
imports, %
2008
9.7
16.6
0.9
10.3
2009
11.5
20.8
0.7
9.5
2010
15.2
23.5
1.2
12.1
2011
18.9
22.7
1.5
12.5
2012
19.1
22.8
1.3
10.3
2013
18.3
21.0
0.9
7.4
2014
16.8
20.0
1.0
8.4
2015
16.2
21.3
0.8
8.2
2016
17.2
23.5
0.8
7.5
Source: CEPII BACI, Eurostat RAMON, UN Comtrade, UN Trade Statistics, and authors’ calculations
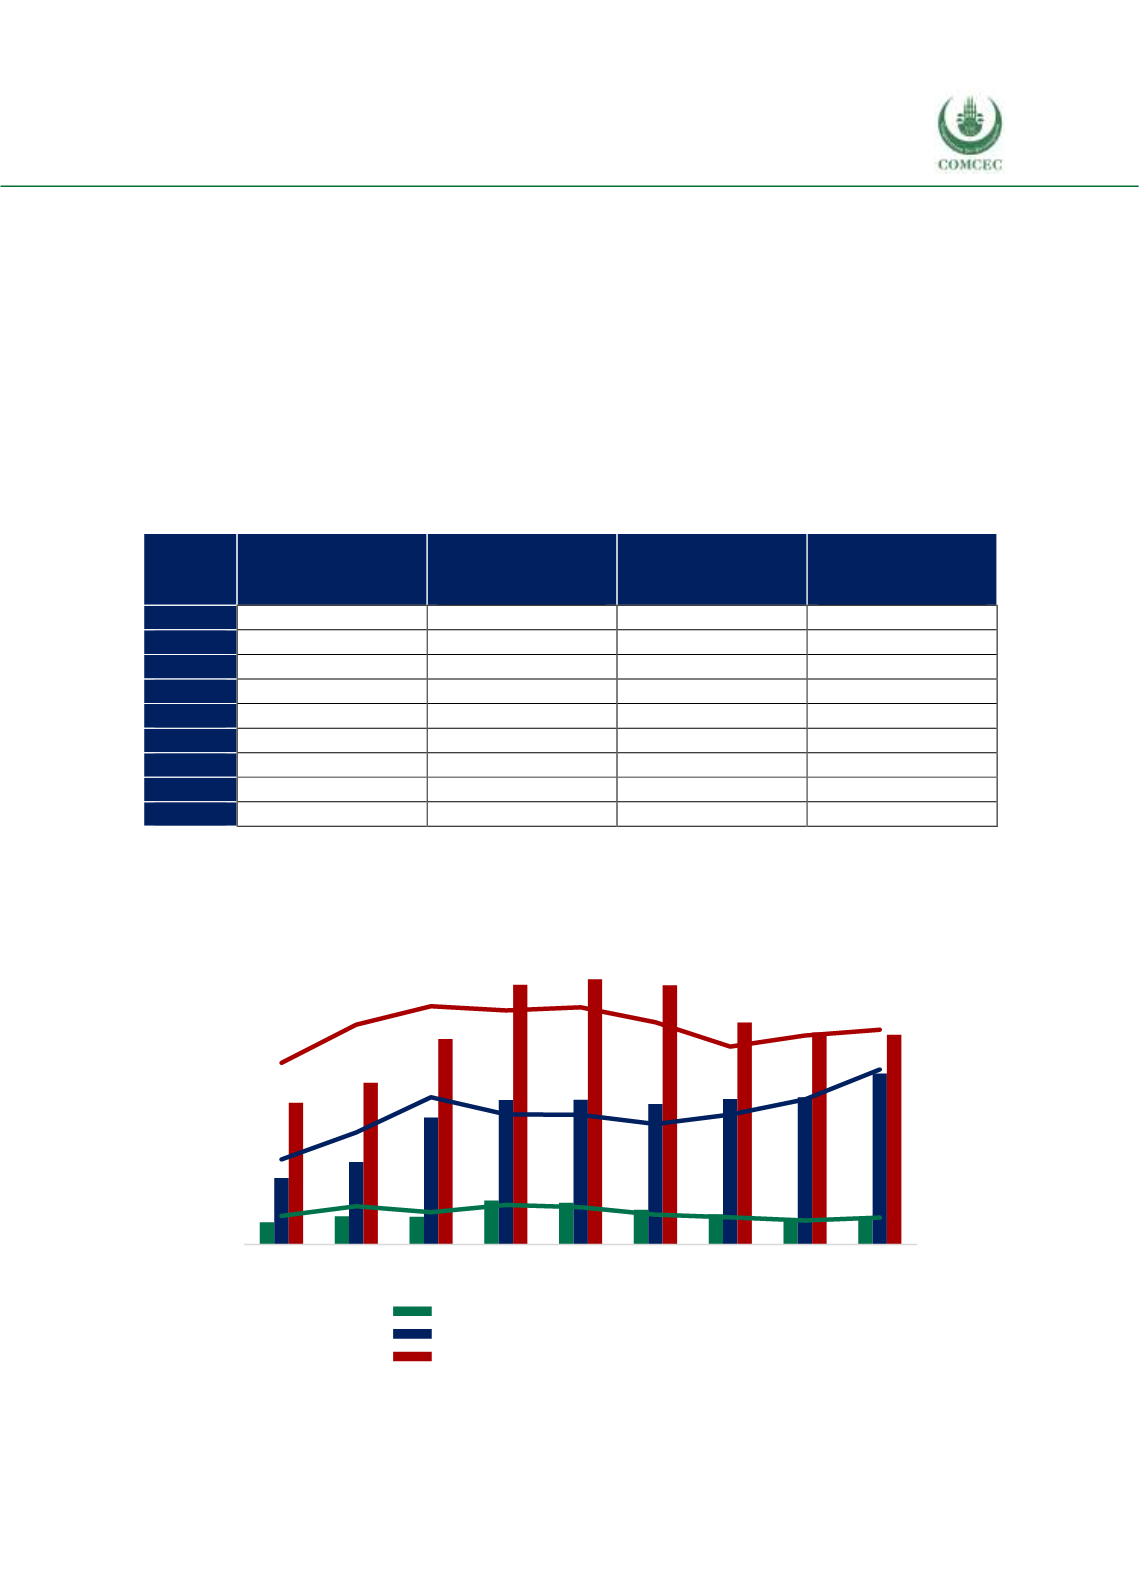
Figure 4.64 illustrates the distribution of Brazil’s agricultural exports according to the three OIC
country groups.
Figure 4. 64 Share Of OIC Groups In Brazil’s Agricultural Exports
Source: CEPII BACI, Eurostat RAMON, UN Comtrade, UN Trade Statistics, and authors’ calculations
0
2
3
5
6
8
9
11
12
0
2
4
6
8
10
12
14
16
2008 2009 2010 2011 2012 2013 2014 2015 2016
African Group (billion USD)
Asian Group (billion USD)
Arab Group (billion USD)
billion USD
%