


 155 / 272

Reviewing Agricultural Trade Policies
To Promote Intra-OIC Agricultural Trade
143
To complete the analysis, the external trade with the OIC countries will be examined at product
level.
Top 5 Agricultural export and import products of Thailand in the OIC Markets
According to the latest available three-year averages (2014-2016), the products that have the
top five shares in Thailand’s total agricultural exports to the OIC countries are (top 5 agricultural
export products to the OIC):
04: Cereals
06: Sugars
23: Crude rubber
03: Fish
05: Vegetables, fruit
with percentage shares of 34.4 percent, 16.3 percent, 14.4 percent, 12.2 percent, and 7.2 percent,
respectively, representing in total 84.5 percent of total agricultural exports.
With regards to Thailand’s top agricultural imports from the OIC countries, according to the
latest available three year averages (2014-2016), the products that have the top five shares in
Thailand’s total agricultural imports from the OIC countries are (top 5 agricultural import
products to the OIC):
03: Fish
09: Miscellaneous p.
41-42-43: Oils, fats, waxe
07: Coffee, tea, cocoa, spices
04: Cereals
with percentage shares of 21.4 percent, 10.2 percent, 10.1 percent, 10.0 percent, and 8.9 percent,
respectively, representing in total 60.6 percent of total agricultural imports.
Thailand’s agricultural trade with OIC countries mainly consists of cereals, sugars, crude rubber,
fish and vegetables, fruit in exports and of fish, miscellaneous, oils, fats, waxe, coffee, tea, cocoa,
spices and cereals in imports. Cereals and fish there are both exported and imported.
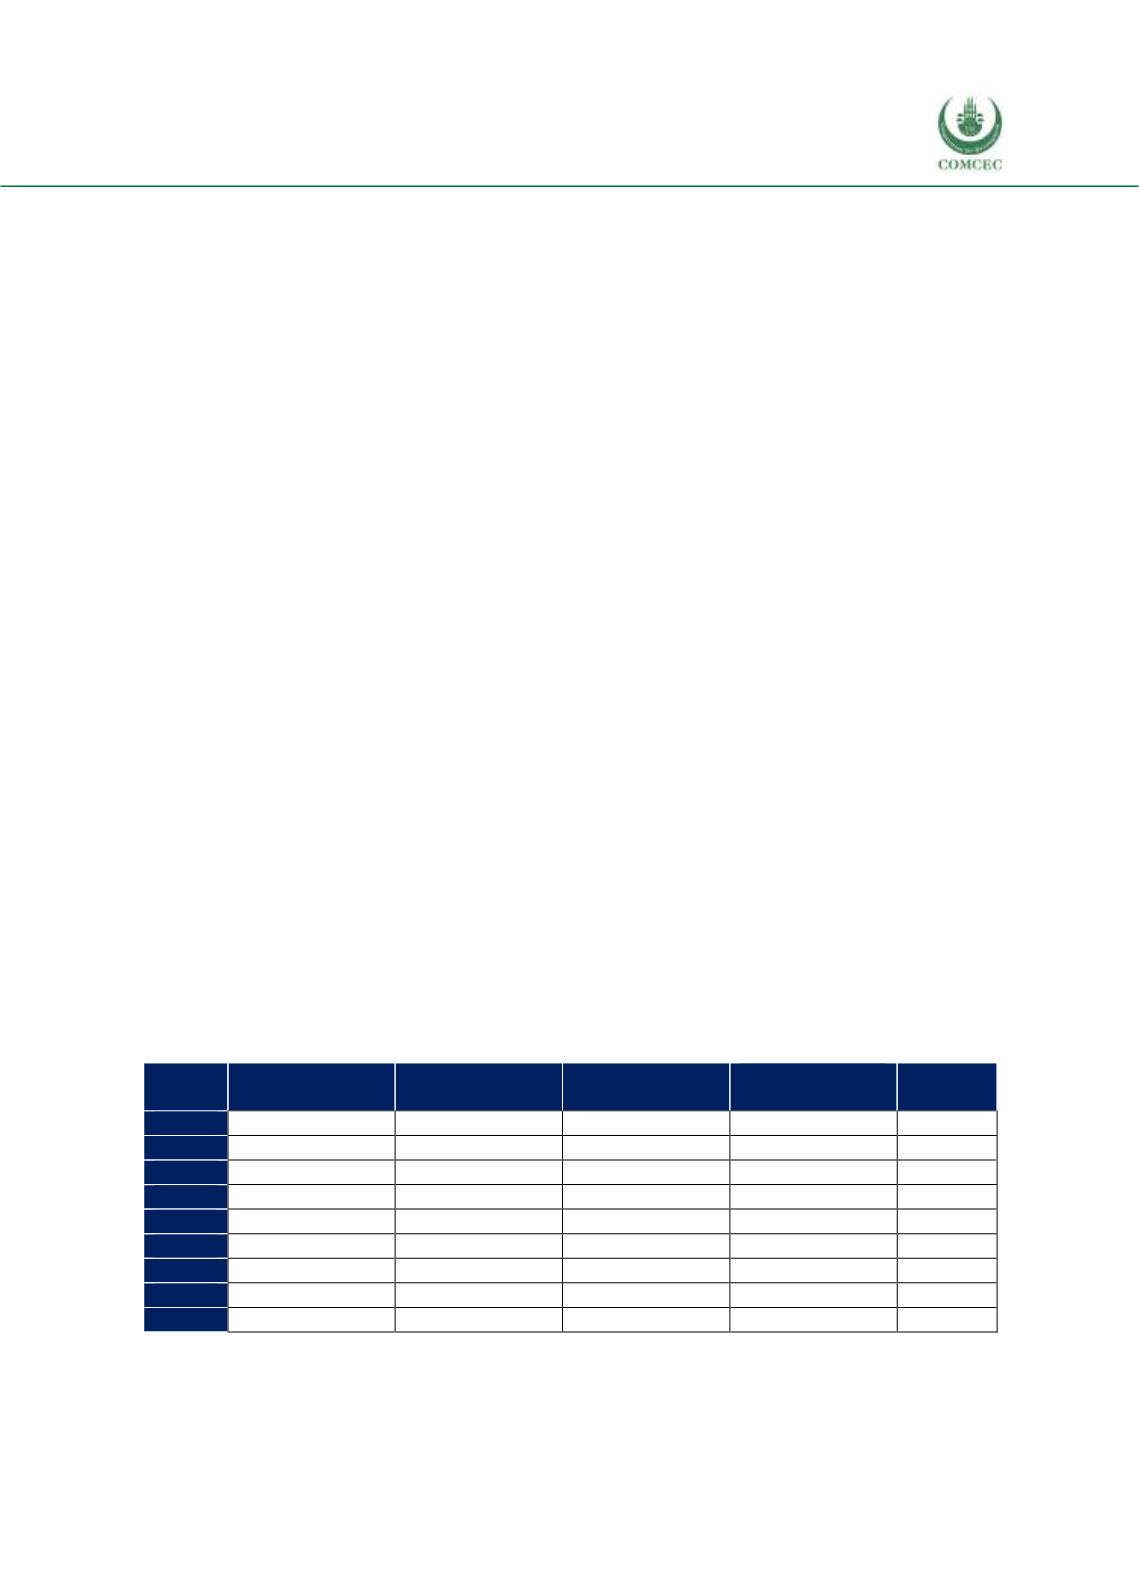
However the greatest part of the exports in those 5 export products is to non-OIC countries, with
an increasing trend since 2008 and having attained roughly 80 percent of the total agricultural
exports, versus 75 percent at the beginning (Table 4.48).
Table 4. 48 Distribution of Thailand’s Top 5 Export Products, by Destination, %
African group
Asian group
Arab group
Non-OIC
Countries
Total
2008
7.7
11.1
6.5
74.8
100
2009
7.6
9.9
6.4
76.1
100
2010
5.6
11.4
5.3
77.7
100
2011
4.6
12.6
5.2
77.7
100
2012
4.6
11.1
6.7
77.7
100
2013
4.3
10.3
6.6
78.9
100
2014
7.0
10.7
5.4
77.0
100
2015
5.2
9.3
5.8
79.7
100
2016
5.9
10.2
4.2
79.6
100
Source: CEPII BACI, Eurostat RAMON, UN Comtrade, UN Trade Statistics, and authors’ calculations
The share of non-OIC countries as the origin of the top five import products is even higher and
with an increasing trend, since it was 90 percent in 2016 versus 87 percent in 2008 (Table 4.49).