


 153 / 272

Reviewing Agricultural Trade Policies
To Promote Intra-OIC Agricultural Trade
141
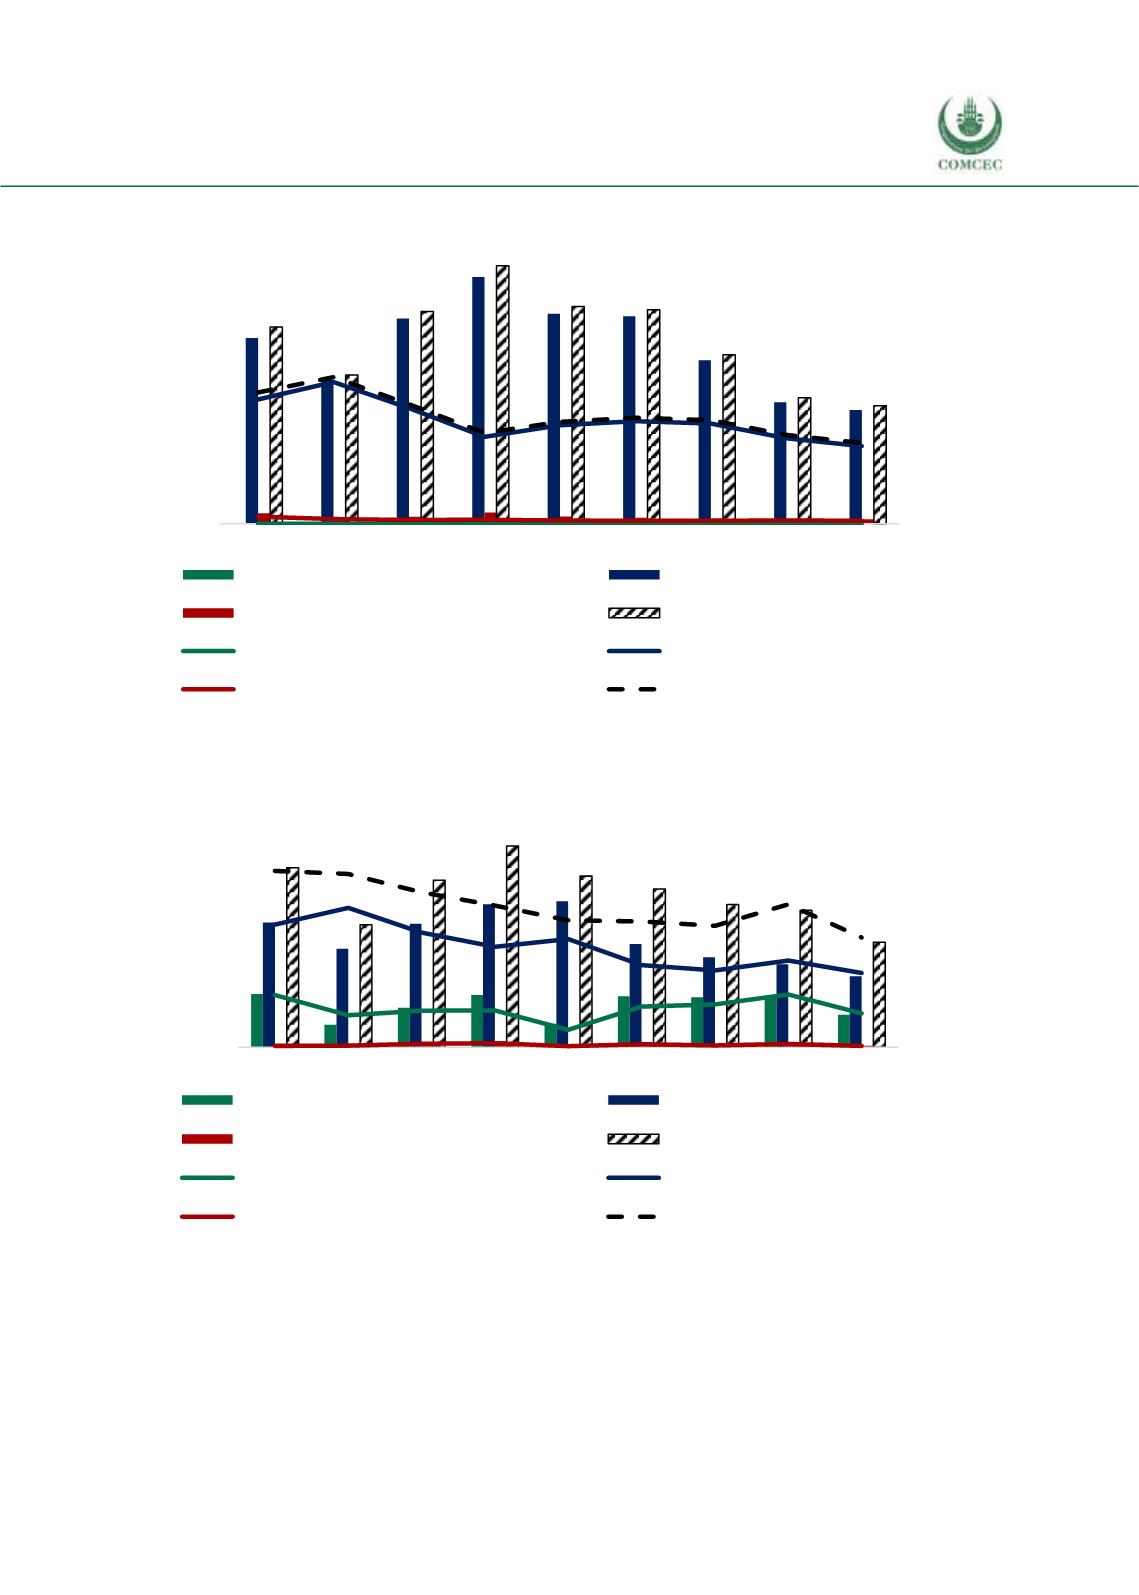
Figure 4. 56 Thailand’s Agricultural Raw Materials Exports to the OIC Groups
Source: CEPII BACI, Eurostat RAMON, UN Comtrade, UN Trade Statistics, and authors’ calculations
Figure 4. 57 Thailand’s Agricultural Raw Materials Imports from the OIC Groups
Source: CEPII BACI, Eurostat RAMON, UN Comtrade, UN Trade Statistics, and authors’ calculations
The situation somehow differs when it comes to the exports of fish products to the OIC countries
in Figure 4.58. Thailand has an increasing export trend in this category with the largest share
exported to the Arab group, followed by Asian group with a stable trend. Obviously Thailand has
a comparative advantage in Fish products and manages to diversify its export markets since
0
200
400
600
800
1.000
1.200
1.400
1.600
1.800
2.000
0
4
8
12
16
20
24
28
32
36
40
2008 2009 2010 2011 2012 2013 2014 2015 2016
African Group (million USD)
Asian Group (million USD)
Arab Group (million USD)
OIC Total (million USD)
African share in total agri-raw exp. (%)
Asian share in total agri-raw exp. (%)
Arab share in total agri-raw exp. (%)
OIC share in total agri-raw exp.
(%)
million USD
%
0
100
200
300
400
500
0
5
10
15
20
25
2008 2009 2010 2011 2012 2013 2014 2015 2016
African Group (million USD)
Asian Group (million USD)
Arab Group (million USD)
OIC Total (million USD)
African share in total agri-raw imp. (%)
Asian share in total agri-raw imp. (%)
Arab share in total agri-raw imp. (%)
OIC share in total agri-raw imp.
(%)
%
million USD