


 151 / 272

Reviewing Agricultural Trade Policies
To Promote Intra-OIC Agricultural Trade
139
has the lowest share in Thailand’s total agricultural exports, none of the three groups’ share is
higher than 10 percent.
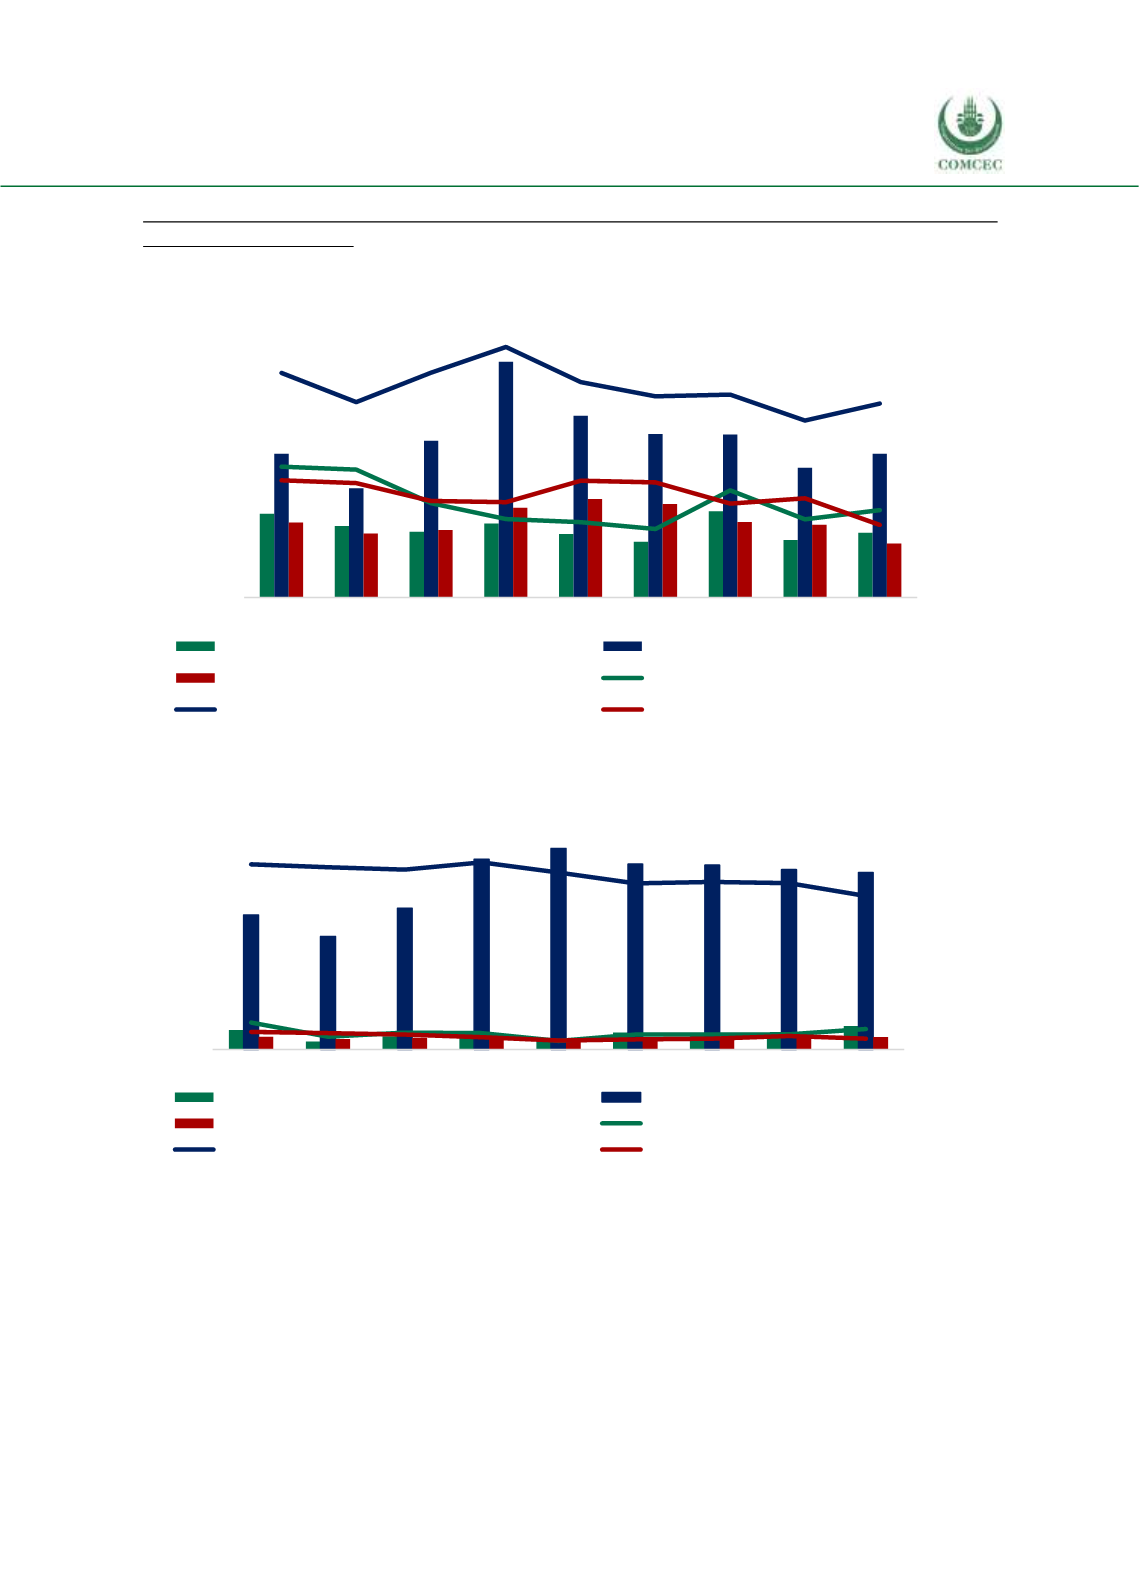
Figure 4. 52 Share of OIC Groups in Thailand’s Agricultural Exports
Source: CEPII BACI, Eurostat RAMON, UN Comtrade, UN Trade Statistics, and authors’ calculations
Figure 4. 53 Share of OIC Groups in Thailand’s Agricultural Imports
Source: CEPII BACI, Eurostat RAMON, UN Comtrade, UN Trade Statistics, and authors’ calculations
Figure 4.53 shows the distribution of Thailand’s agricultural imports according to the three OIC
member country groups. Here again the lowest share of imports among the three OIC groups is
of the Arab group with less than 1 percent. The African group’s share is slightly over 1%, with
the Asian group around 9 percent. In addition, all three groups share in Thailand agricultural
imports decreased from 2008 to 2016. However due to the increase in total exports of
agricultural products, this does not mean a reduction in the volume, for the African and Asian
Groups, while the Arab group maintained the very low level of agricultural exports to Thailand
around 100 million USD annually.
0
1
2
3
4
5
6
7
0
2
4
6
8
10
12
14
2008 2009 2010 2011 2012 2013 2014 2015 2016
African Group (billion USD)
Asian Group (billion USD)
Arab Group (billion USD)
African share in total agricultural exp. (%)
Asian share in total agricultural exp. (%)
Arab share in total agricultural exp. (%)
billion USD
%
0,0
0,4
0,8
1,2
1,6
2,0
0
3
6
9
12
15
2008 2009 2010 2011 2012 2013 2014 2015 2016
African Group (billion USD)
Asian Group (billion USD)
Arab Group (billion USD)
African share in total agricultural imp. (%)
Asian share in total agricultural imp. (%)
Arab share in total agricultural imp. (%)
billion USD
%