


 152 / 272

Reviewing Agricultural Trade Policies
To Promote Intra-OIC Agricultural Trade
140
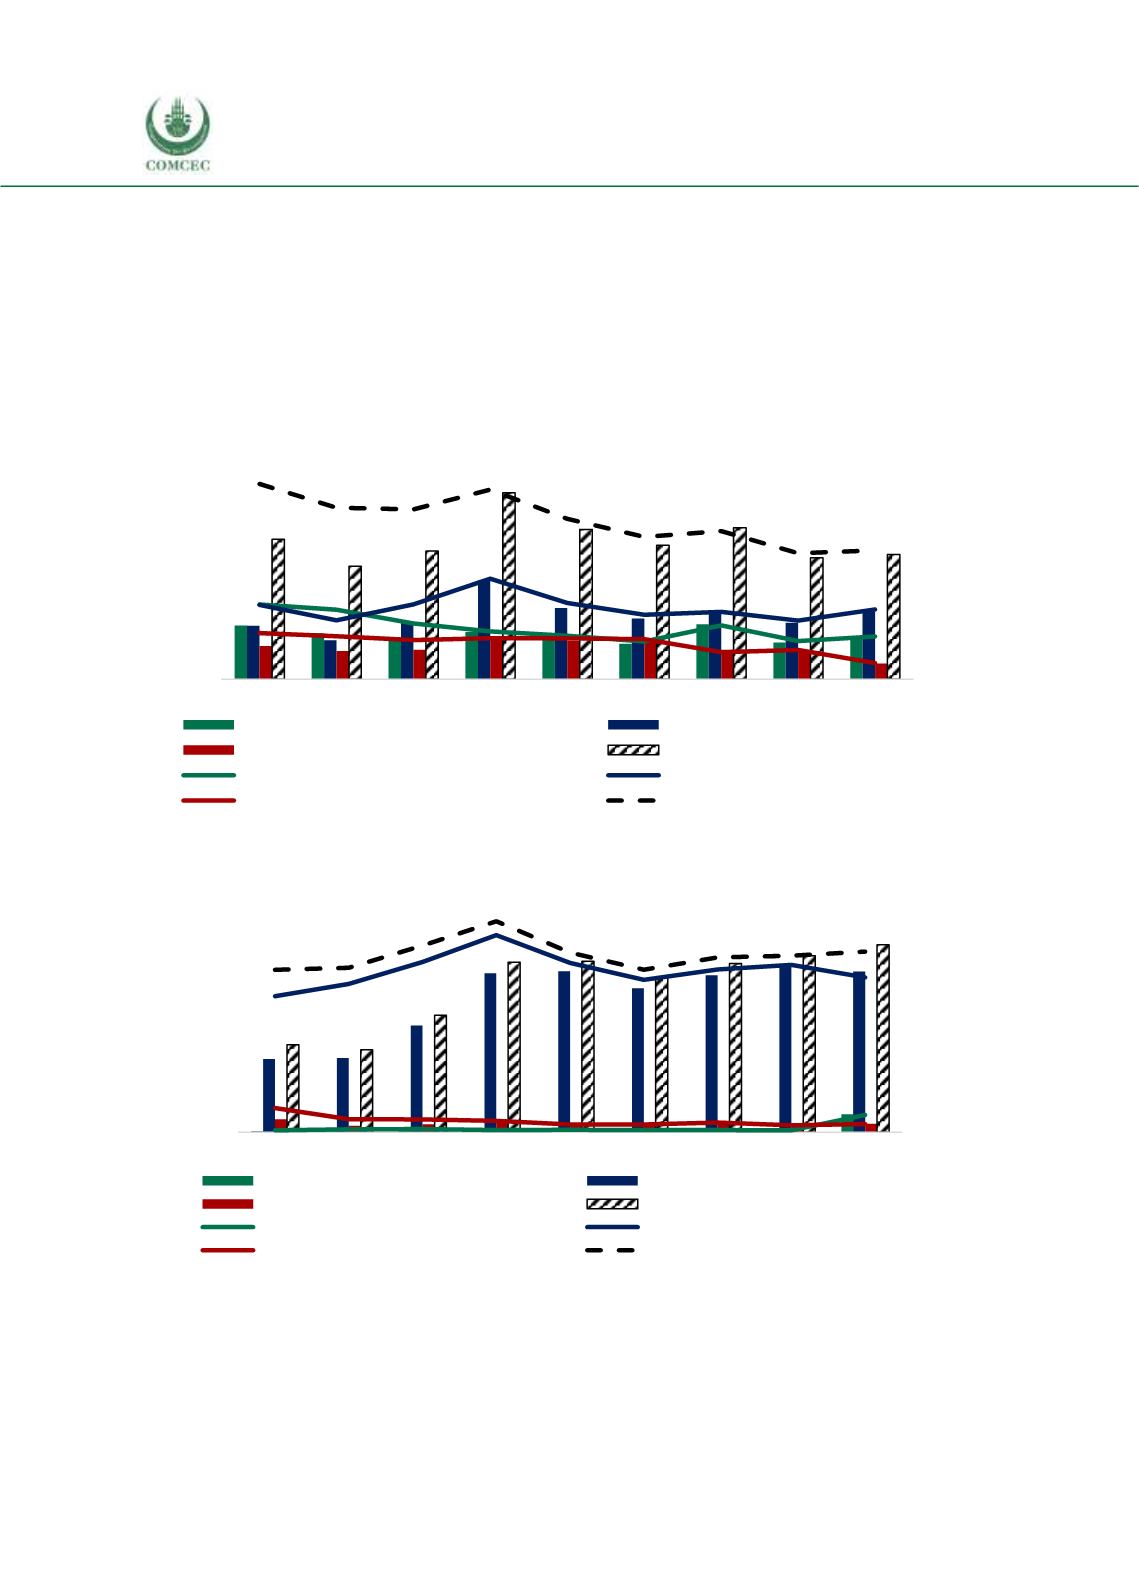
Figure 4.54 and 4.55 show respectively, Thailand’s exports and imports of agri-food products
from OIC countries. The total agri-food products exports show a clear decreasing trend while
the only group maintaining a stable trend around 10% is the Asian group, the other two groups
share being very low and decreasing. When it comes to the imports of agri-food products, the
total exceeded only modestly 1 billion USD, before going down and stabilizing around 1 billion
USD. Thailand imports of agri-food products from OIC countries comes largely from the Asian
group. There is only a turn upwards in the imports from the African group in 2016, however it
is difficult to say anything at this stage.
Figure 4. 54 Thailand’s Agri-Food Products Exports to the OIC Groups
Source: CEPII BACI, Eurostat RAMON, UN Comtrade, UN Trade Statistics, and authors’ calculations
Figure 4. 55 Thailand’s Agri-Food Products Imports from the OIC Groups
Source: CEPII BACI, Eurostat RAMON, UN Comtrade, UN Trade Statistics, and authors’ calculations
For agricultural raw materials exports of Thailand to the OIC countries, the Asian group
dominates. However the volume is very low and diminishing, the same situation is observed in
imports with the Asian group having the largest share with the African group having a higher
share than in the exports, although a volume of imports in 2016, less than 100 million USD.
0
1
2
3
4
5
6
7
8
0
4
8
12
16
20
24
28
32
2008 2009 2010 2011 2012 2013 2014 2015 2016
African Group (billion USD)
Asian Group (billion USD)
Arab Group (billion USD)
OIC Total (billion USD)
African share in total agri-food exp. (%)
Asian share in total agri-food exp. (%)
Arab share in total agri-food exp. (%)
OIC share in total agri-food exp. (%)
%
billion
0
200
400
600
800
1000
1200
1400
0
2
4
6
8
10
12
14
2008 2009 2010 2011 2012 2013 2014 2015 2016
African Group (million USD)
Asian Group (million USD)
Arab Group (million USD)
OIC Total (million USD)
African share in total agri-food imp. (%)
Asian share in total agri-food imp. (%)
Arab share in total agri-food imp. (%)
OIC share in total agri-food imp. (%)
%
million USD