


 158 / 272

Reviewing Agricultural Trade Policies
To Promote Intra-OIC Agricultural Trade
146
Thailand states that the country has a good record of notifications to the WTO. However,
notifications related to domestic support in agriculture were remaining at the time the report
was published. Thailand recovered this in 2017 and notified WTO regarding domestic support
related to agriculture for the years 2014, 2015 and 2016. This is a clear evidence of Thailand’s
intention of liberalizing its trade and fulfilling the WTO requirements.
The top 5 import and export products of Thailand will be now looked at, concerning the tariff
protection they are subject to. The sharp decrease in all the products average tariffs in Table
4.52 during the period considered is a result of both the country’s decisiveness towards
liberalizing its external trade while strengthening its competitiveness as well as its ASEAN
membership, since the share of the trading block in the country’s external trade is considerable.
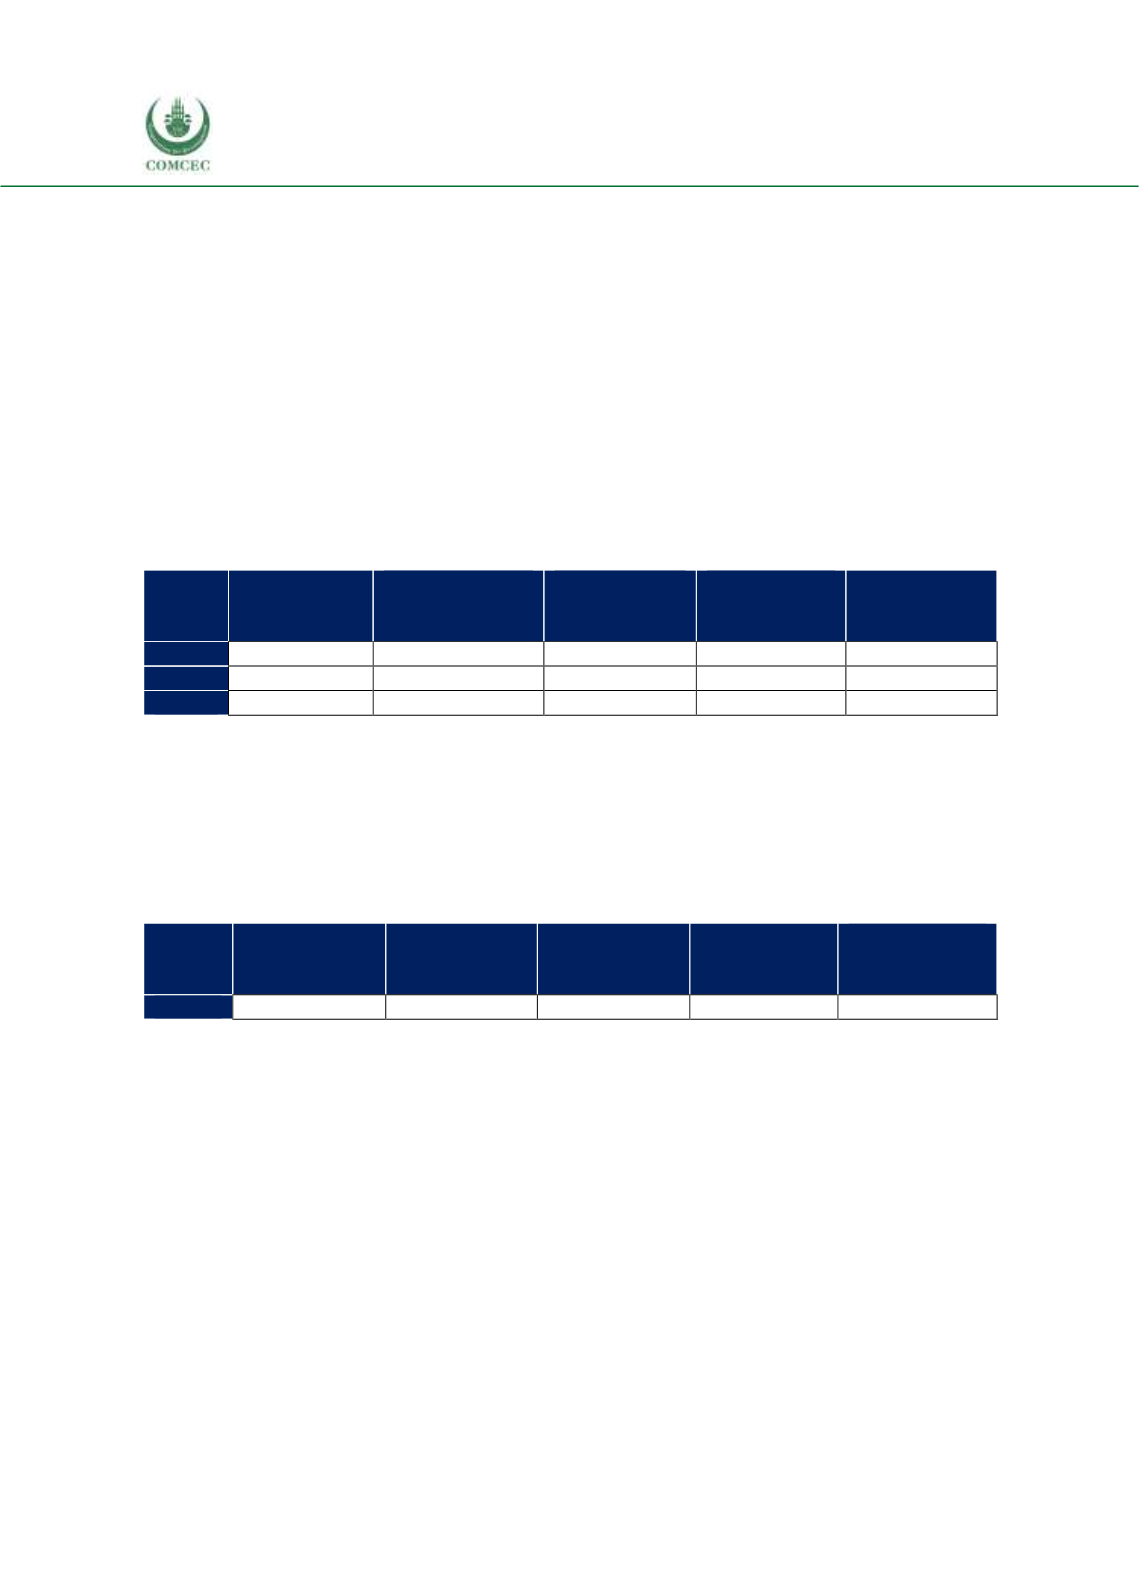
With regard to tariff rates for Thailand’s top five import products from the top 5 OIC exporters,
Table 4.52 presents the available data. The 2016 tariff rates demonstrate that tariff rates for oils,
fats, waxe are lowest while the tariff rates for cereals are highest.
Table 4. 52 Tariffs Set by Thailand for Top 5 Import Products from the OIC Exporters, %
03: Fish
09:
Miscellaneous
p.
41-42-43:
Oils, fats,
waxe
07: Coffee,
tea, cocoa,
spices
04: Cereals
2003
4.7
4.5
2.3
5.0
4.9
2014
2.6
0.0
0.0
0.0
0.3
2015
1.4
0.0
0.1
1.5
4.4
Source: ITC Macmap, CEPII BACI, Eurostat RAMON, UN Comtrade, UN Trade Statistics, and authors’
calculations
Note. Top 5 products are identified considering 3 year average between 2014 and 2016 and ad valorem
equivalent (%) rates are considered for applied tariff rates.
Concerning the tariffs applied to Thailand’s top 5 export products by the top 5 OIC importing
countries, the highest tariff is applied to sugar, followed by cereals, those two products being
considered strategic worldwide (Table 4.53).
Table 4. 53 Tariffs Set by OIC Countries for Thailand’s Top 5 Export Products, %
04: Cereals
06: Sugars
23: Crude
rubber
03: Fish
05:
Vegetables,
fruit
2016
9.8
13.5
0.0
3.1
1.6
Source: ITC Macmap, CEPII BACI, Eurostat RAMON, UN Comtrade, UN Trade Statistics, and authors’
calculations
Note. Top 5 products are identified considering 3 year average between 2014 and 2016 and ad valorem
equivalent (%) rates are considered for applied tariff rates.
NTMs
Table 4.54 summarizes the numbers of NTMs that have been imposed by Thailand and that are
currently in force. In animal products, nearly 90 percent of animal products are subject to NTMs
and this ratio is 80 percent in vegetables, 90 percent in Food products and 100 percent in hides
and skins. The wood products are the less protected category by NTMs.