


 150 / 272

Reviewing Agricultural Trade Policies
To Promote Intra-OIC Agricultural Trade
138
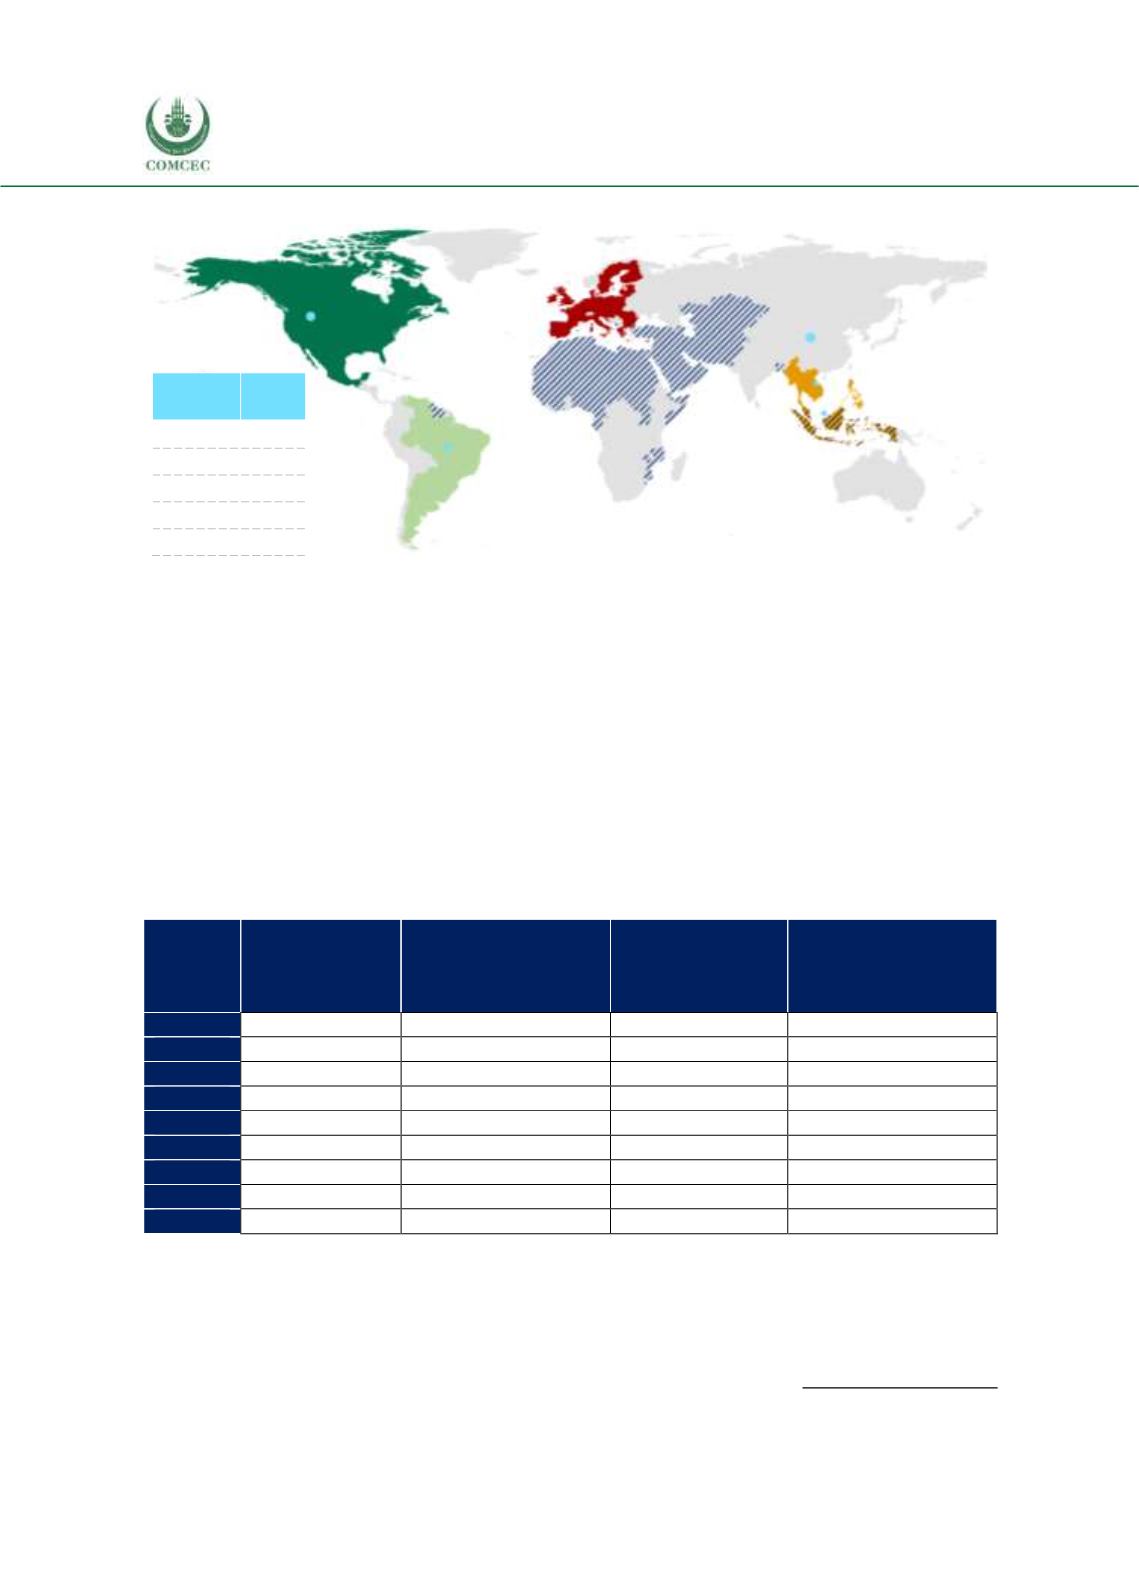
Figure 4. 51 Breakdown of Thailand’s Agricultural Import Origins, 2016
Source: CEPII BACI, Eurostat RAMON, UN Comtrade, UN Trade Statistics, authors’ visualizations
4.5.1. Agricultural Trade with the OIC Countries
General overview
In spite of its status as a founding member of the ASEAN, the bloc’s share in Thailand’s exports
and imports have been relatively low (23 percent and 21 percent respectively, in 2016). Thai
imports made up 16 percent of the ASEAN agricultural exports, and Thai exports amounted to 8
percent of total agricultural imports of ASEAN.
By contrast, the OIC member countries’ share in the external trade of Thailand decreased during
2008-2016. Thailand recorded an agricultural trade surplus of 4.5 billion USD with the OIC
partners in 2016, down from 5.7 billion USD in 2008.
Table 4. 47 Value & Share of OIC Countries in Thailand’s Agricultural Trade
Year
Value
(exports)
billion USD
Share in Thailand’s
total agricultural
exports, %
Value
(imports)
billion USD
Share in Thailand’s
total agricultural
imports, %
2008
7.1
22.3
1.4
14.1
2009
5.8
20.7
1.1
12.9
2010
6.8
19.6
1.4
12.9
2011
9.4
20.0
1.8
13.2
2012
8.1
19.2
1.8
11.9
2013
7.4
18.2
1.7
11.7
2014
7.7
19.1
1.7
11.8
2015
6.1
16.7
1.7
11.9
2016
6.2
16.7
1.7
11.3
Source: CEPII BACI, Eurostat RAMON, UN Comtrade, UN Trade Statistics, and authors’ calculations
Figure 4.52 shows the distribution of Thailand’s agricultural exports to the three OIC member
country groups. The shares of all three groups’ in total agricultural exports of Thailand fell from
2008 to 2016. The Asian group’s share slightly declined from 10.6 to 9.2 percent, while the
African group’s share went down from 6.2 to 4.1 percent. Similarly, the share of the Arab group
decreased from 5.5 percent and 3.4 percent in total agricultural exports. While the Arab group
EU-28
%9
NAFTA
%14
MERCOSUR
%11
ASEAN
%21
OIC %11
Top 5
Partner
Share
China
15%
USA
12%
Brazil
8%
Malaysia
5%
Viet Nam 4%