


 154 / 272

Reviewing Agricultural Trade Policies
To Promote Intra-OIC Agricultural Trade
142
despite the increase of the share of OIC countries lately, it only represents 14 percent of its
exports of Fish products.
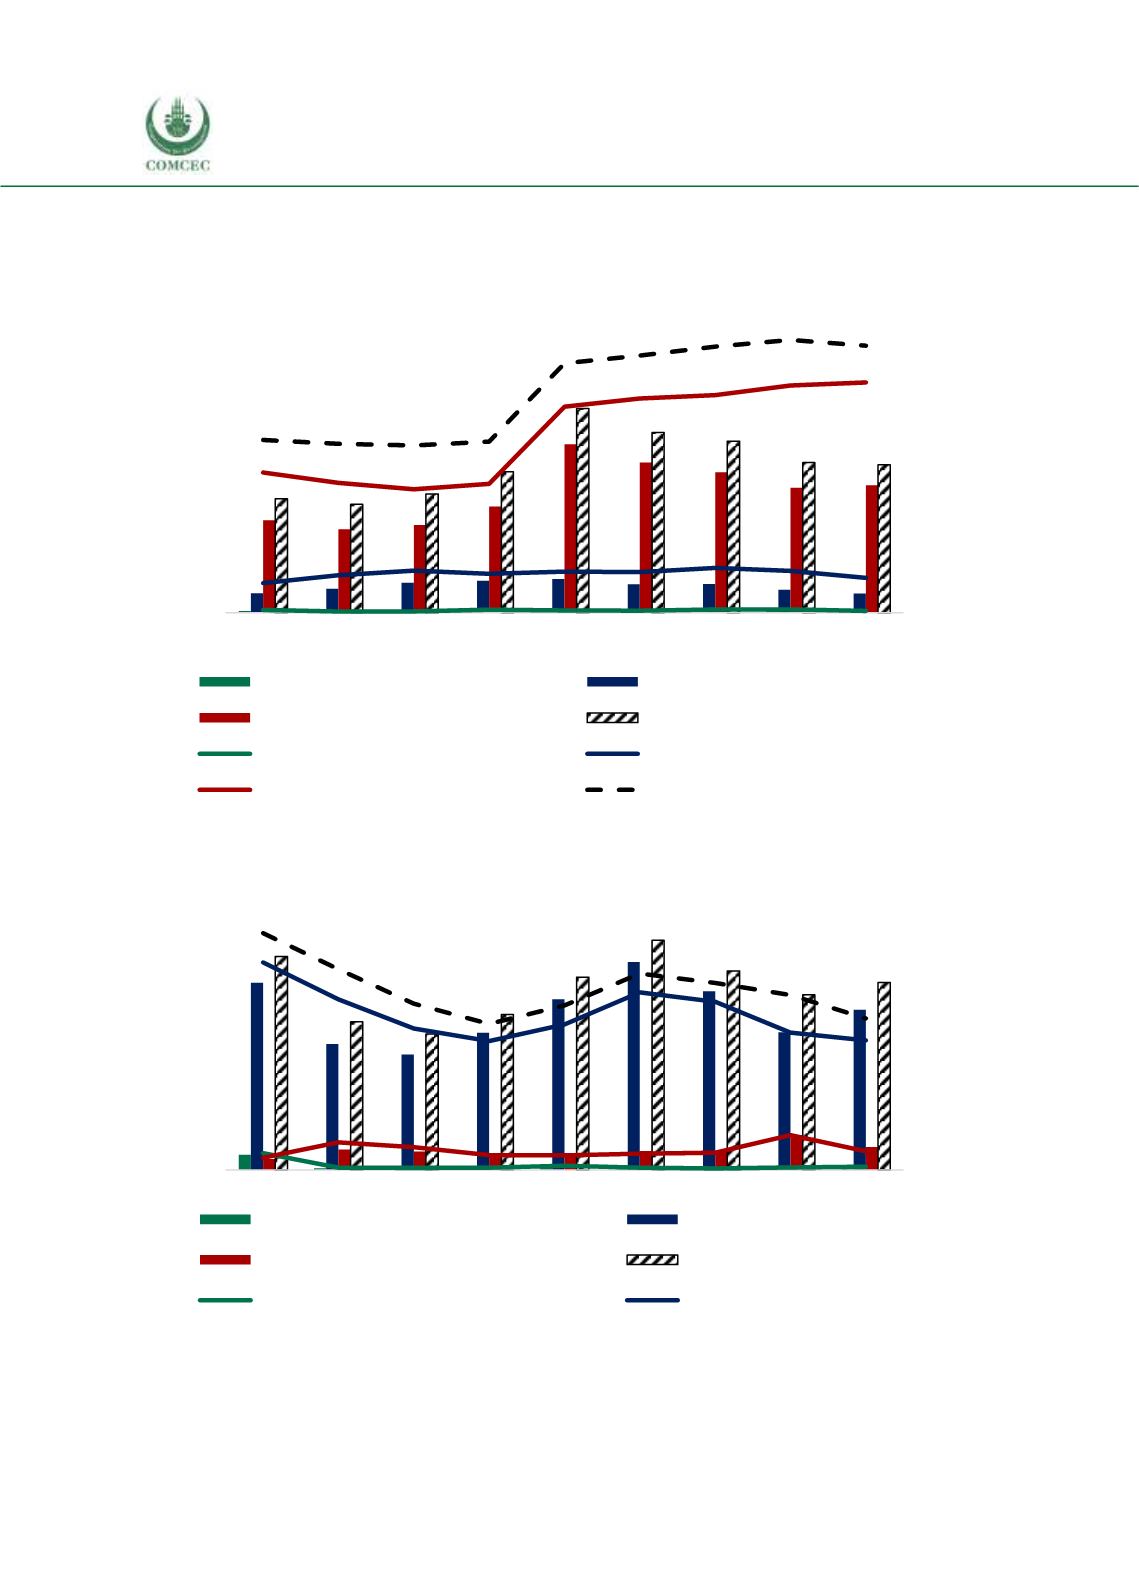
Figure 4. 58 Thailand’s Fish Products Exports to the OIC Groups
Source: CEPII BACI, Eurostat RAMON, UN Comtrade, UN Trade Statistics, and authors’ calculations
Figure 4. 59 Thailand’s Fish Products Imports from the OIC Groups
Source: CEPII BACI, Eurostat RAMON, UN Comtrade, UN Trade Statistics, and authors’ calculations
Looking at the imports of fish products fromOIC countries, a negative trend is clearly seen, again
with the largest part imported from the Asian group also with a negative trend (Figure 4.59)
0
200
400
600
800
1000
1200
1400
1600
0
2
4
6
8
10
12
14
16
2008 2009 2010 2011 2012 2013 2014 2015 2016
African Group (million USD)
Asian Group (million USD)
Arab Group (million USD)
OIC Total (million USD)
African share in total fish exp. (%)
Asian share in total fish exp. (%)
Arab share in total fish exp. (%)
OIC share in total fish exp. (%)
million USD
%
0
100
200
300
400
500
0
5
10
15
20
2008 2009 2010 2011 2012 2013 2014 2015 2016
African Group (million USD)
Asian Group (million USD)
Arab Group (million USD)
OIC Total (million USD)
African share in total fish imp. (%)
Asian share in total fish imp. (%)
million USD
%